Highlights
The highlights section gives you a high-level overview of your assessment summary of the analytics performed on the selected workloads.
In this Topic:
Data Warehouse Workloads
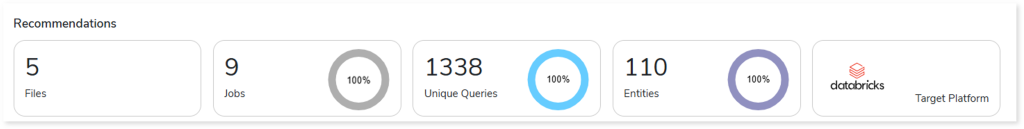
Recommendations
This section provides a snapshot of recommendations generated by the system as per the recommendation settings provided while creating the assessment. It recommends the number of files, jobs, unique queries, and entities that should be migrated. It also suggests the target platform as per your enterprise’s needs.
Files
This section provides an overview of analyzed files based on the key resource utilization metrics. It displays the total number of files, used files, unused files, used and unused queries. In addition, it offers insights into the complexity of used and unused queries.
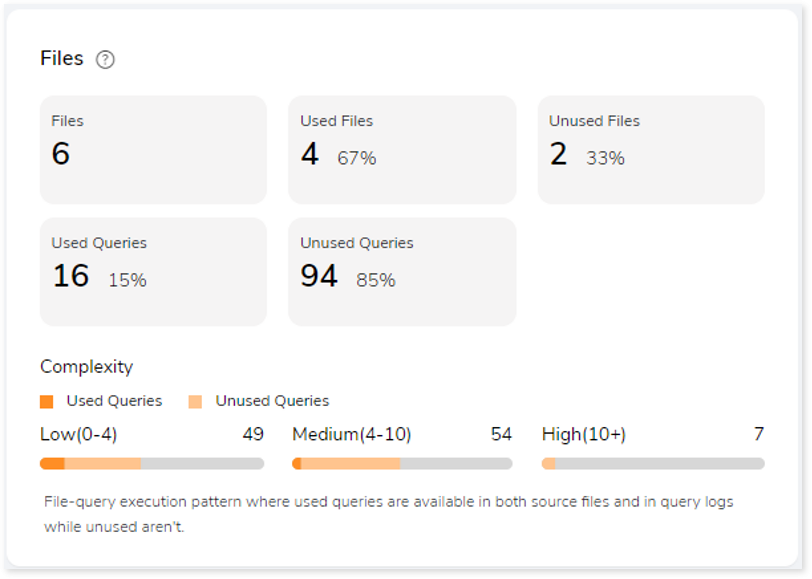
- Files: The total number of files available in the source file.
- Used Files: Displays the number of files where used queries are available in both DML scripts and Execution logs.
- Unused Files: Displays the number of files where used queries are not available in both DML scripts and Execution logs.
- Used Queries: Displays the number of queries that are used in both DML scripts and Execution logs.
- Unused Queries: Displays the number of queries that are used in DML scripts but not in Execution logs.
Orchestration Inventory
This section provides orchestration details including the total number of job input files, jobs, files used from those jobs and so on. A job is a set of tasks that control the system for scheduling, monitoring, and reporting.
Job types include schedulers or orchestration scripts, like:
- AutoSys: AutoSys is an automated job control system designed to schedule tasks. You can create jobs in Autosys as JIL (Job Information Language) format.
- Control-M: Control-M is a workflow orchestration solution by which you can manage workflow for data and applications on-premises or in the cloud.
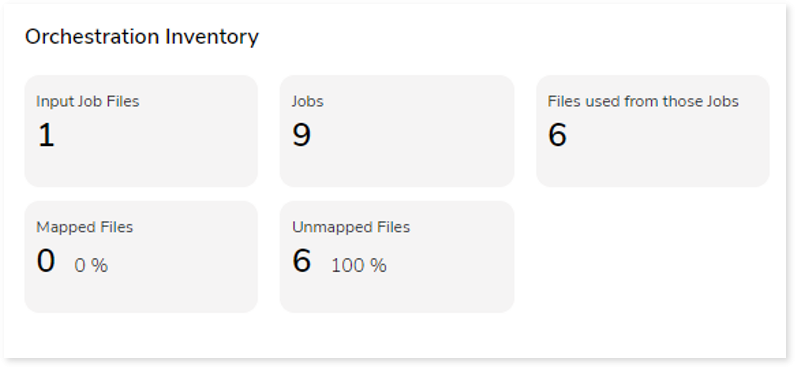
- Input Job Files: Total number of job files.
- Jobs: A job is a set of tasks that control the system for scheduling, monitoring, and reporting. It can be in the form of any command, file, or script.
- Files used from those jobs: Displays the number of DML files that are called by the Job scripts.
- Mapped Files: If the jobs and input source files are the same and can be mapped, they are referred to as mapped files.
- Unmapped Files: If the jobs and input source files are different and unable to map, they are referred to as unmapped files.
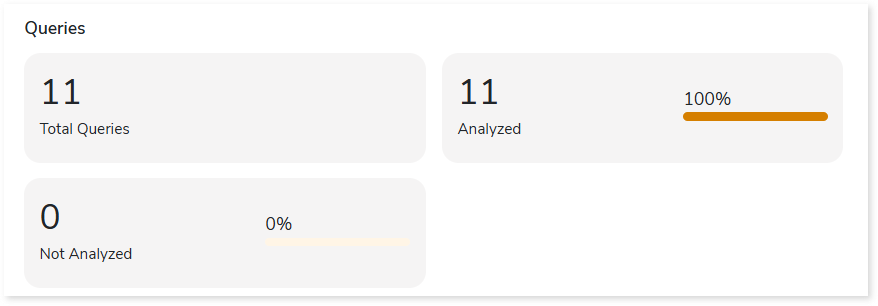
Queries
It displays a synopsis of the analyzed queries with information about unique text, unique pattern queries as well as analyzed and unanalyzed queries.
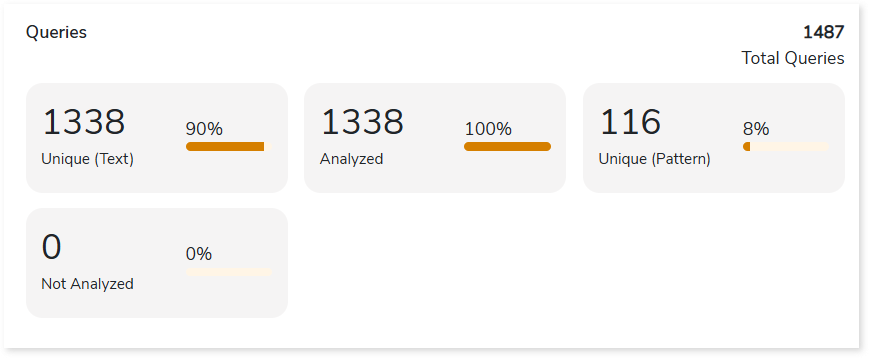
- Unique (Text): Displays the number of unique queries.
- Unique (Pattern): Displays the number of unique query patterns. It identifies the distinct query structures, but the query structure’s values may change.
- Analyzed: Displays the number of analyzed queries.
- Not Analyzed: Displays the number of not analyzed queries.
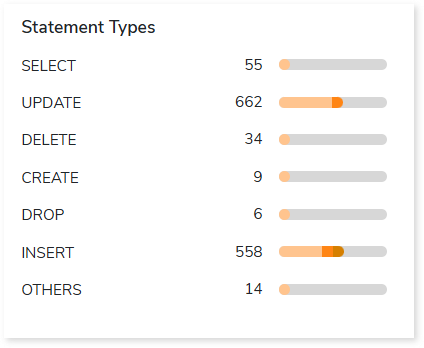
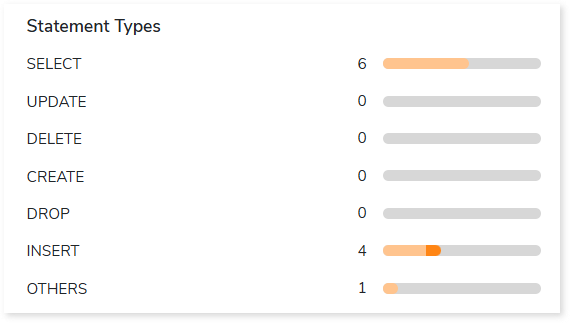
Statement Types
This section displays a summary of analyzed queries categorized by distinct query statement types in the input source file.
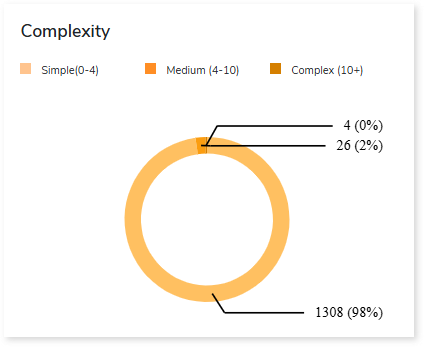
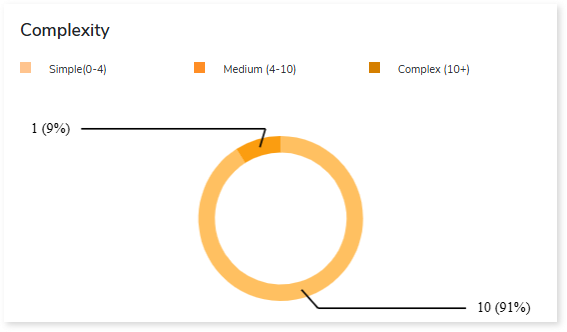
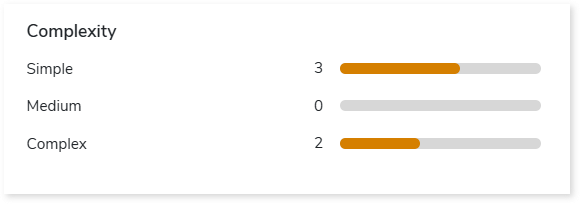
Complexity
This section provides a summarized graphical representation of query complexity that helps in making different decisions, including budget estimation.
| Complexity Type | Complexity Range | Description |
| Low | 0-4 | Handled directly by the tool, it requires no manual effort. |
| Medium | 4-10 | Most of the queries can be converted directly by the tool, and some require minimum manual effort. |
| High | 10+ | Complexity is high and requires more manual effort to handle. |
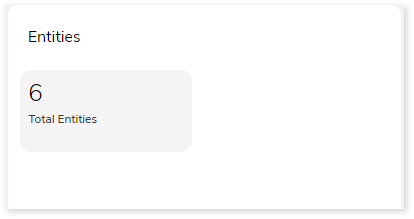
Entities
This section provides a synopsis of the analyzed entities with information regarding the Tables and Views in the source file.

- Tables: Displays number of tables.
- Views: Displays number of views.
- Missing Tables: Tables which are used in DML scripts/ query logs, but no DDL scripts are associated with them.
- Used Tables: Tables which are used in DML scripts/ query logs.
- Unused Tables: Tables which are used in DDL scripts but not used in DML scripts/ query logs.
- Used Views: Displays the number of used views.
- Unused Views: Displays the number of unused views.
- Unparsed Views: Displays the number of unparsed views.
Entity Usage Type
This section provides information about the analyzed entities sorted by different entity usage types.
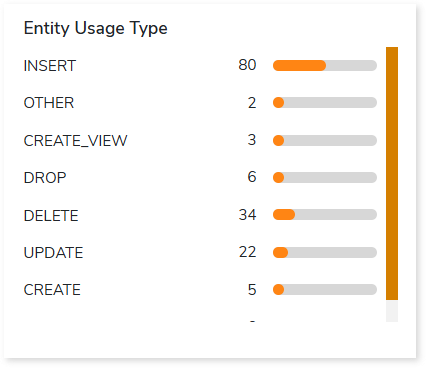
Table Type
This section provides summary of queries segregated by the break-up of table types. Table types are categorized according to the different statement types available in the input workload.
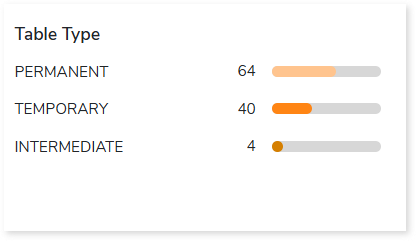
- Permanent: In DML, if the encountered statement types such as READ, UPDATE, and INSERT are considered permanent tables. For instance, tables that are created and perform actions but are not deleted are permanent tables.
- Intermediate: If the statement type CREATE is encountered, it refers to an intermediate table, or whenever a table is created and no actions are being performed, it is considered an intermediate table.
- Temporary: If the statement type CREATE and DROP are encountered, they refer to a temporary table. In other words, a table that is created and then deleted is considered a temporary table.
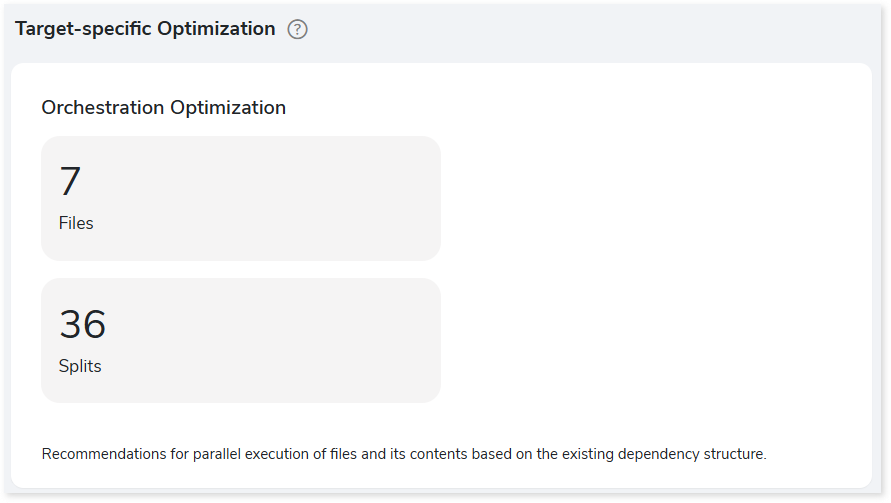
Target-specific Optimization
This section provides target optimization recommendations at the schema, and orchestration levels. Schema Optimization focuses on efficient schema design and effective data retrieval. Orchestration Optimization provides information about the parallel execution of files based on their dependency structure.
Stored Procedure
Files
This section provides information about input source files including procedures, functions, and queries.
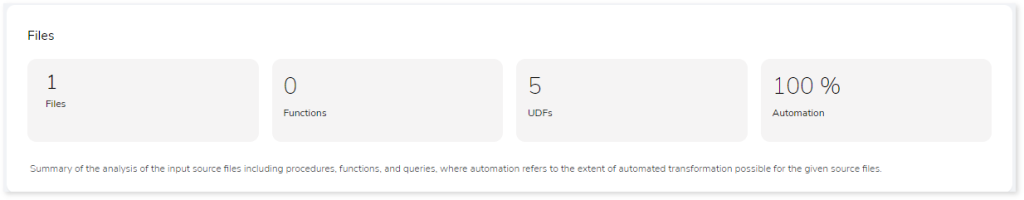
- Files: Displays the number of input source files (stored procedures).
- Functions: Displays the number of functions.
- UDFs: Displays the number of User-defined functions.
- Automation: Automation refers to the extent of automated transformation possible for the given source files.
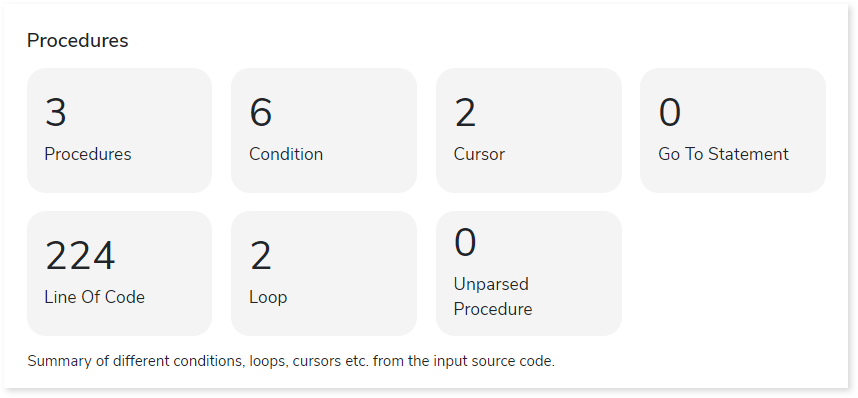
Procedures
This section provides a summary of analyzed procedures which includes details about its content such as condition, cursor, loop, and more.
Queries
It displays a synopsis of the analyzed queries.
- Total Queries: Displays total number of queries in the source file (stored procedures).
- Analyzed: Displays the number of queries that meet the analysis criteria.
- Not Analyzed: Displays the number of queries that did not meet the analysis criteria.
Statement Types
This section displays a summary of analyzed queries categorized by distinct query statement types in the input source file.
Complexity
This section provides a summarized graphical representation of queries’ complexity that helps in making different decisions, including budget estimation.
Entities
This section provides a synopsis of the analyzed entities with information regarding the Tables and Views in the source file.
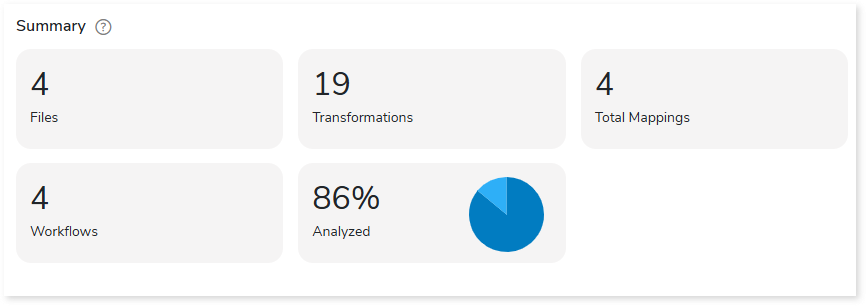
Summary
This section illustrates the input informatica graphs that were analyzed throughout the various workflows and components. Here, you can see the number of files, transformations, mappings and workflows as well as the analyzed percentage of the workloads.
Scheduler
Schedulers monitor and execute tasks or jobs at a specific time.
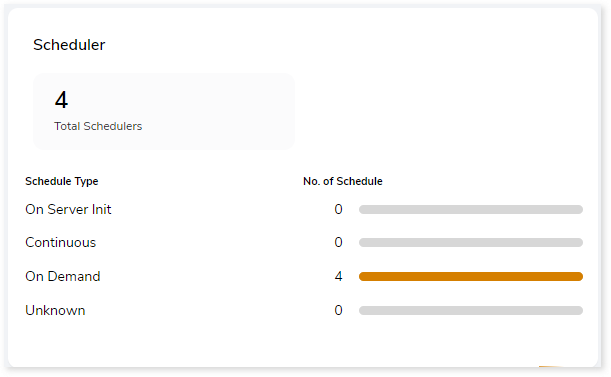
- On Server Init: The jobs are triggered based on the availability of the server.
- Continuous: Jobs that are continuously executed based on a scheduled time.
- On Demand: Jobs that are triggered manually for execution.
- Unknown: Jobs that do not belong to the above categories.
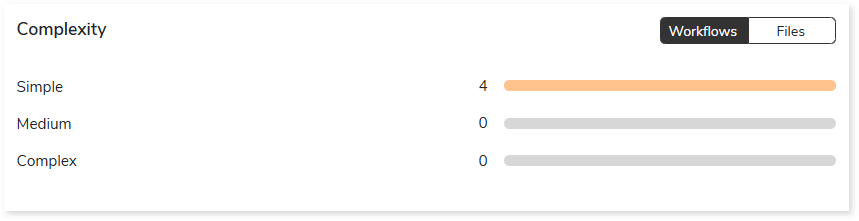
Complexity
This section provides a summarized graphical representation of the classification of Informatica files and workflows based on a detailed complexity assessment. This information is required to make different decisions, including migration planning, estimating budget etc.
BI Workloads
Summary
This section illustrates the input Tableau scripts that were analyzed across the various components. Here, you can see the number of files, data sources, databases, and so on.
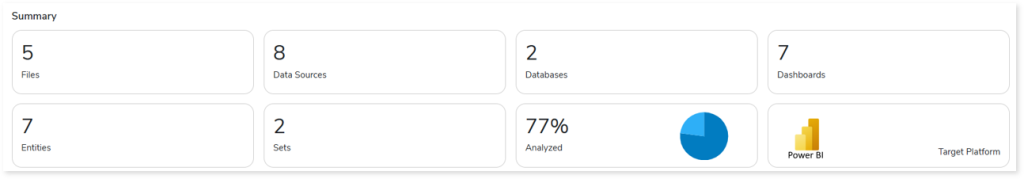
- Files: Displays the total number of input files.
- Data Sources: Displays the number of data sources.
- Databases: Displays the number of databases.
- Dashboards: Displays the number of dashboards.
- Entities: Displays the number of entities.
- Sets: Displays the number of sets.
- Analyzed: Displays the percentage of workloads that have been analyzed.
- Target Platform: Displays the name of the target platform.
Complexity
This section provides a summarized graphical representation of the classification of the Tableau files based on complexity. This information is required to make various decisions, including migration planning, and estimating the budget.
Worksheets
This section provides information about the worksheets used in the dashboard. Worksheets are sheets in the workbook where data is represented in a visual format. Here, you can see the total number of worksheets, used and unused worksheets.
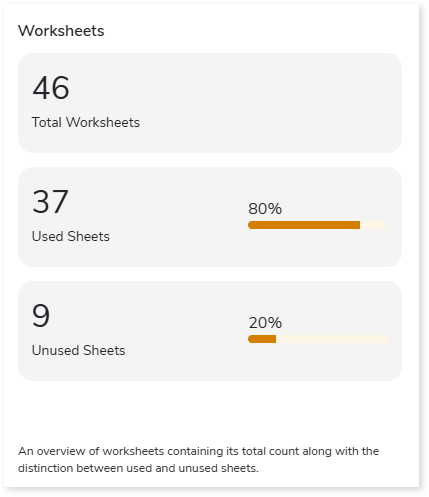
- Total Worksheets: Displays the total number of worksheets.
- Used Sheets: Displays the number of used sheets. Used sheets are worksheets that are used in the dashboard. In other words, a worksheet is considered as used sheet, if its visuals are added in the dashboard.
- Unused sheets: Displays the number of unused sheets. Unused sheets are worksheets that are not used in the dashboard. In other words, a worksheet is considered as unused sheet, if its visuals are not added in the dashboard.
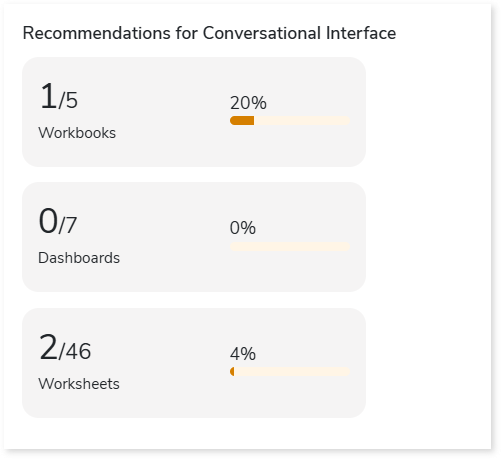
Recommendations for Conversational Interface
This section displays recommendations based on hierarchical structure for different report elements such as workbooks, dashboards, and worksheets. These insights help optimize scope and cost.
Queries
This section displays details of the queries including the number of analyzed, unique, and unanalyzed queries along with the complexity distribution.

- Analyzed: Displays the number of analyzed queries.
- Unique Queries: Displays the number of unique queries.
- Not Analyzed: Displays the number of unanalyzed queries.
- Complexity: Displays the query complexity.
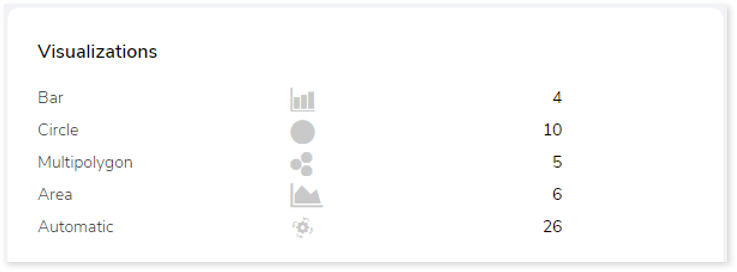
Visualizations
This section displays graphical visualization used in the scripts such as graphs, charts etc. This visual representation of data makes it easy to understand the data.
Columns
This section provides details about the columns in the entities including the total number of columns, number of calculated columns, columns usage type and the number of columns present in it.
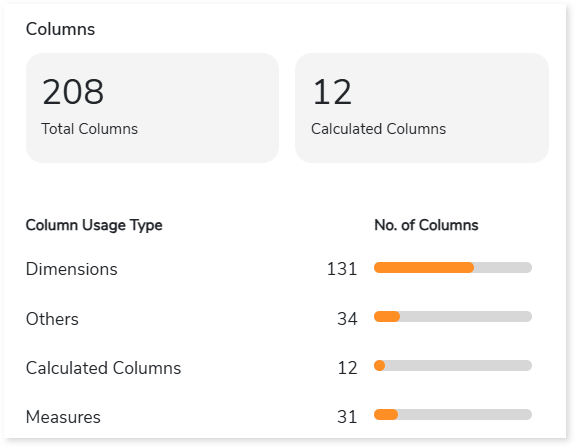
- Total Columns: Total number of columns available in the entities.
- Calculated columns: Columns in which functions or operations such as min, max, sum, avg, etc. are implemented for calculation.
- Columns Usage Type: There are two types of columns:
- Dimensions: Holds qualitative values.
- Measures: Holds numeric values.
Actions
This section provides details about the actions (navigation, filters, URL, etc.) that are performed on the worksheet or dashboard. It allows you to interact with data such as navigation.
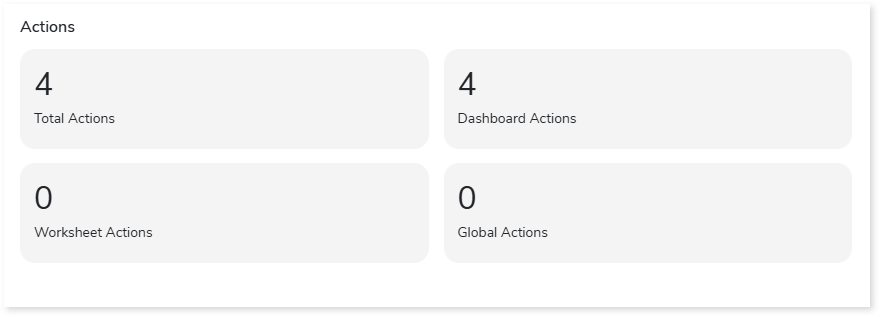
- Total Actions: Total number of actions (filters, URL, etc.) in the report.
- Dashboard Actions: Displays the number of dashboard actions. Dashboard actions are actions that are performed in the dashboard such as navigation, filters, URL, etc.
- Worksheet Actions: Displays the number of worksheet actions. Worksheet actions are actions that are performed in the worksheet such as navigation, filters, URL, etc.
- Global Actions: Displays the number of global actions. global actions are actions (filters, url, etc.) that are applied to worksheets or dashboards across the workbook.
Filters
This section provides information about the filters. It is a process of filtering out the data to minimize the data set size, remove irrelevant records, etc.
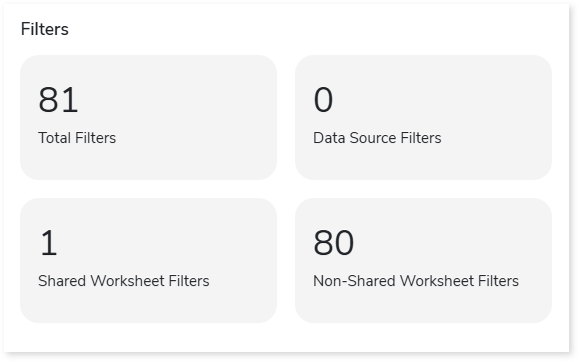
- Total Filters: Displays the total number of filters present in the input artifacts.
- Data Source Filters: Displays the number of filters that are applied to the data sources.
- Shared Worksheet Filters: Displays the number of filters that are applied to the shared worksheets.
- Non-Shared Worksheet Filters: Displays the number of filters that are applied to the non-shared worksheets.
Orchestration Workloads
Summary
This section summarizes the input AutoSys scripts, including the number of files, boxes, jobs, and so on.
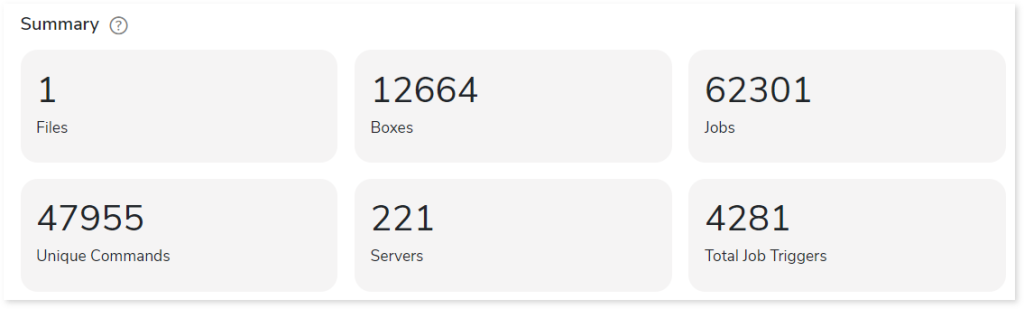
- Files: Number of input source files.
- Boxes: A box job is a container for multiple jobs. It controls scheduling, monitoring, and executing tasks.
- Jobs: Controls the system for scheduling, monitoring, and executing tasks.
- Unique Commands: Displays the number of unique commands.
- Servers: Displays the number of database servers where the AutoSys job details are stored.
- Total Job Triggers: Displays the total number of triggers.
Job Type
This section provides comprehensive information about Autosys job types along with its counts.
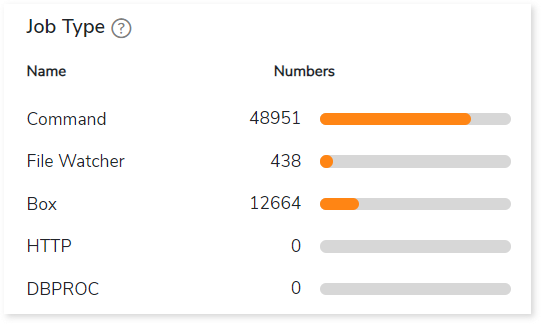
- Command: Used to execute workloads.
- File Watcher: Used to keep track of the presence and size of files.
- Box: A box job is a container for multiple jobs.
- HTTP: Used to invoke HTTP services.
- DBPROC: Used to execute database stored procedures.
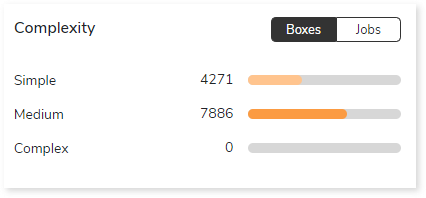
Complexity
This section provides a summarized graphical representation of the complexity of jobs and boxes that helps in making different decisions, including budget estimation and assessing the effort required to transform the workloads.
Job Trigger Frequency
This section provides information about triggers, including the total number of triggers, frequency (such as daily, weekly, and others), and the count of scheduled triggers.
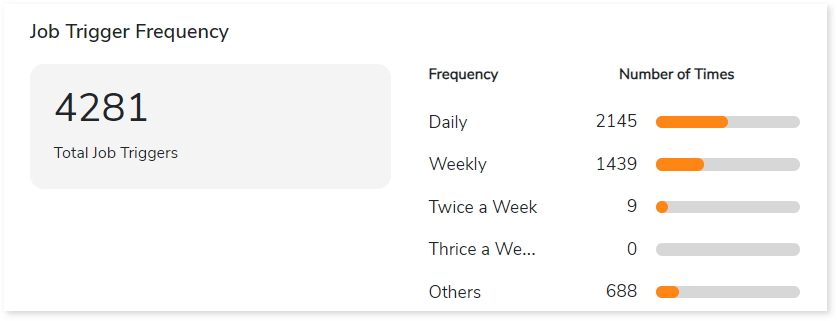
- Total Job Triggers: Displays the total number of triggers.
- Frequency: Displays the frequency of jobs such as daily, weekly, twice a week, etc., along with the number of triggers.
Watch Files
This section provides comprehensive information about watch files, including the total number of watch files, types, and its count.
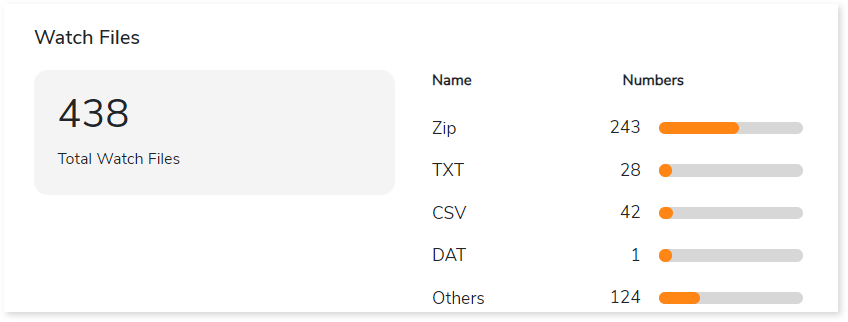
- Total Watch Files: Displays the total number of watch files.
- Name: Displays top 5 watch file types such as Zip, TXT, CSV, etc., along with its count.
Analytics Workloads
Summary
This section illustrates the SAS based analytical scripts that were analyzed across the various elements. It provides details such as the number of files, macros, data steps, the percentage of code analyzed successfully, duplicity-related information, and more.
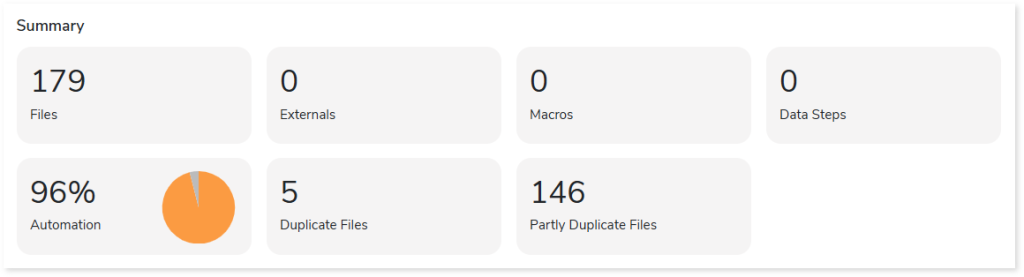
- Files: Displays the total number of input files.
- Externals: Displays the number of external files.
- Macros: Displays the number of macros.
- Data Steps: Displays the number of data steps.
- Automation: Displays the anticipated automation conversion percentage.
- Duplicate Files: Displays the number of duplicate files present in the input files.
- Partly Duplicate Files: Displays the number of partially duplicate files present in the input files.
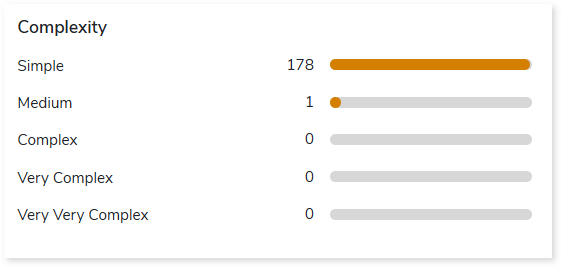
Complexity
This section provides a summarized graphical representation of the complexity of SAS scripts that helps in making different decisions, including budget estimation. The complexity of the SAS script is calculated based on various parameters like external access, conditional procedural statement, external resources, total SQL statement, and procedures.
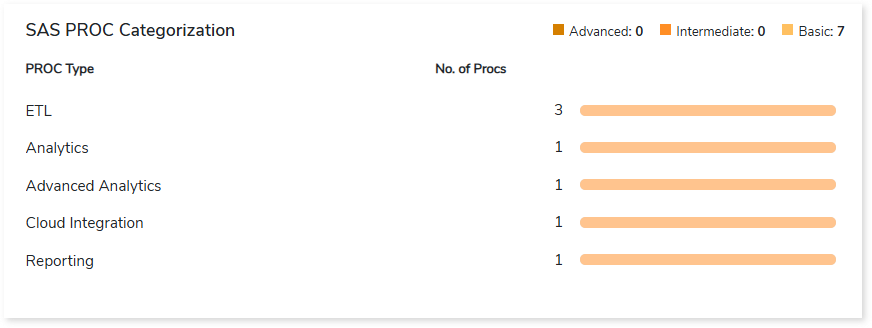
SAS PROC Categorization
This section provides an overview of different types of SAS PROCs, categorized as basic, intermediate, and advanced depending on their level of sophistication.
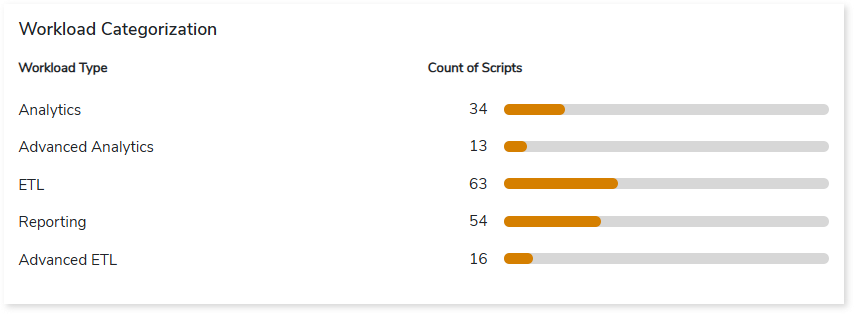
Workload Categorization
This section provides information about the categorization of SAS code based on the workload types such as ETL, analytics, reporting, etc.
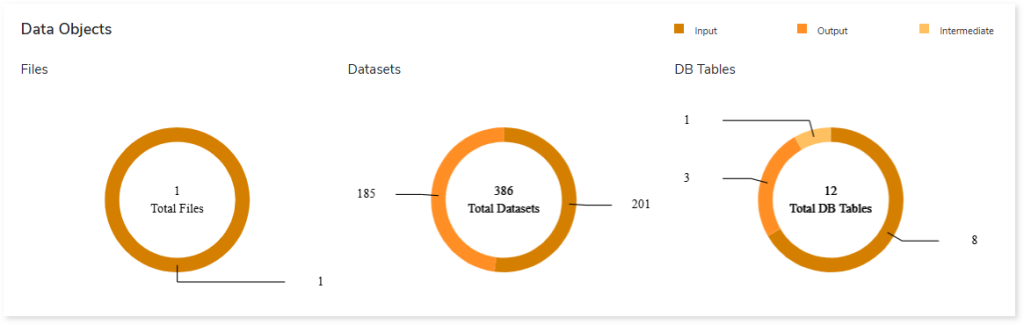
Data Objects
This section provides an overview of total files, datasets, and database tables along with their categorization.
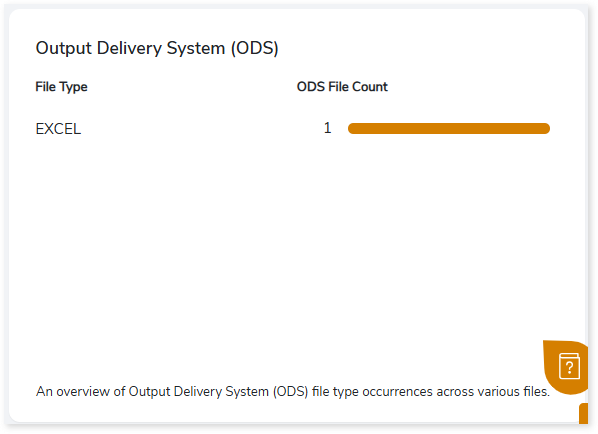
Output Delivery System (ODS)
This section provides an overview of the Output Delivery System (ODS) file type, including its occurrences across various files.