Semantic Harmonization
Semantic Harmonization aligns enterprise metadata with industry-specific ontologies and compliance frameworks to ensure consistent and accurate interpretation across data sources, schemas, and repositories. Instead of applying static industry labels, it maps customer data models to relevant domain standards—such as financial, healthcare, or other regulatory ontologies—based on the selected business context.
With native alignment to industry-specific ontologies and regulatory semantics (for example, financial ontologies such as FIBO), enterprise datasets can be mapped to standardized domain terminology, delivering consistent business definitions, traceability, and governed interpretation across the metadata estate. This alignment establishes a foundational semantic layer and supports the creation of an enterprise knowledge graph. The platform also evaluates semantic precision—identifying exact, close, and contextual matches—while generating completeness, compliance, and alignment reports, enabling trusted business interpretation and downstream AI readiness.
Key Capabilities
The key capabilities include:
- Alignment with domain-specific ontologies and regulatory semantics
- Ontology-driven mapping of enterprise metadata and datasets
- Semantic precision assessment
- Completeness, compliance, and alignment reporting
- A trusted semantic foundation for governance and downstream AI readiness
In This Topic:
Map Metadata to a Standard Ontology
Semantic Harmonization maps your metadata to standard ontologies and identifies semantic mapping and compliance opportunities across your data assets.
Steps to map your metadata to a standard ontology:
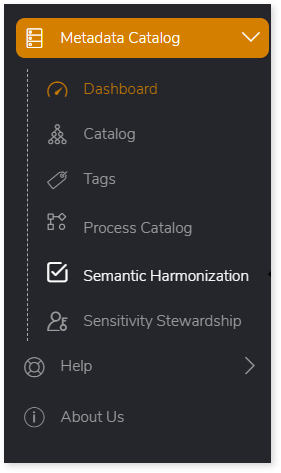
- Log in to Impetus LeapLogic Catalog.
- From the left navigation pane, select Metadata Catalog > Semantic Harmonization.
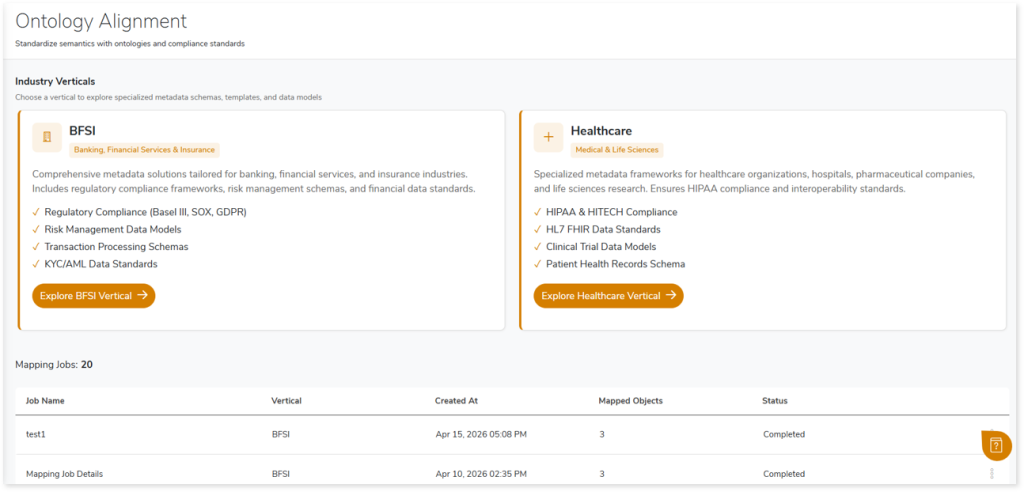
- The Ontology Alignment page opens, displaying the available Industry Verticals.
- Select the required vertical (for example, click Explore BFSI Vertical).
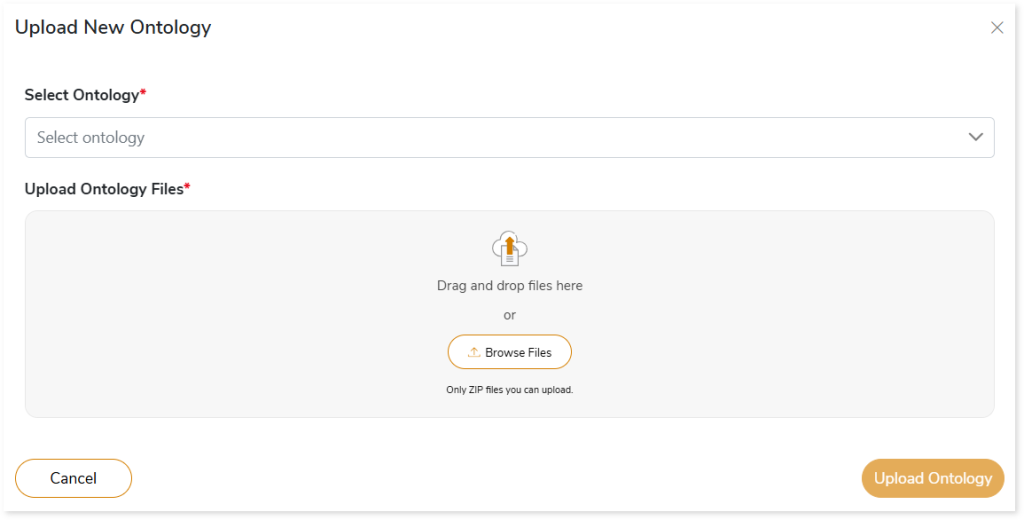
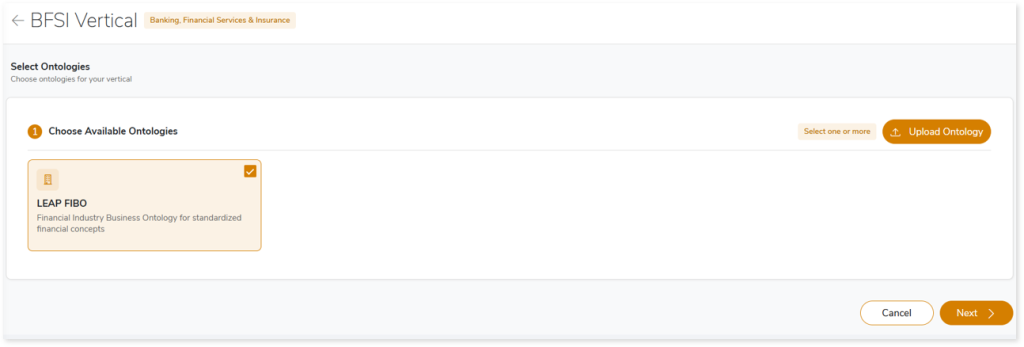
- On the Select Ontologies page, select the required ontology. Alternatively, you can add a new ontology as follows:
- Click Upload Ontology.
- Select the ontology from the list.
- Upload the ontology files (ZIP format).
- Click Upload Ontology to add it.
- Click Next to proceed.
- On the Data Source Mapping page, map data sources or repositories to the selected ontologies.
- From the left panel (Repositories & Data Sources), drag data sources or entire repositories and drop them onto the selected ontology on the right.
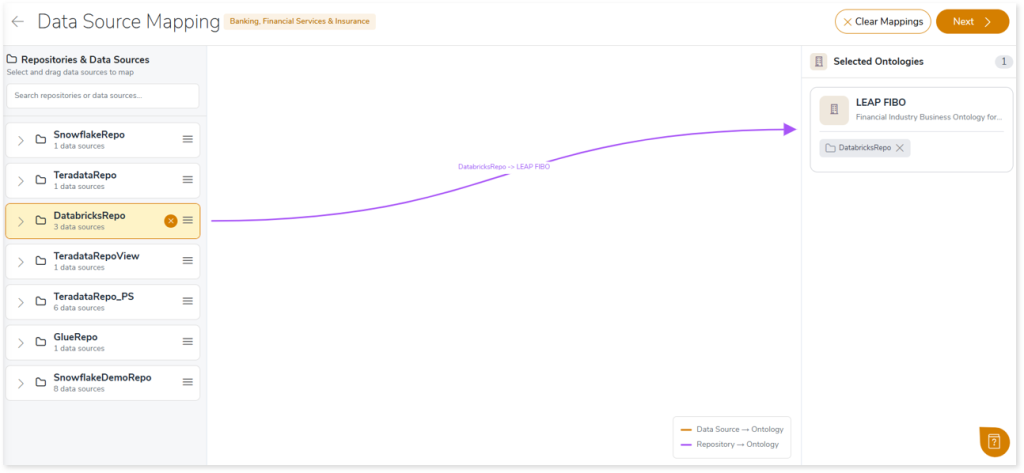
- Click Next after completing the mappings.
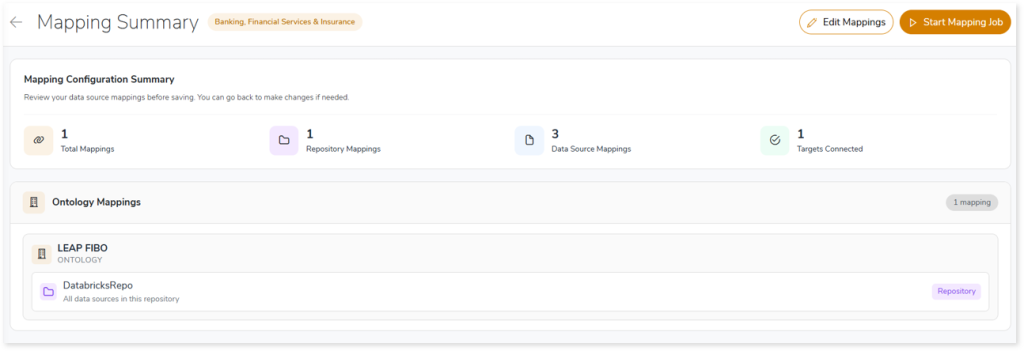
- On the Mapping Summary page, review the data source mappings, make edits if required using Edit Mappings, and click Start Mapping Job to proceed.
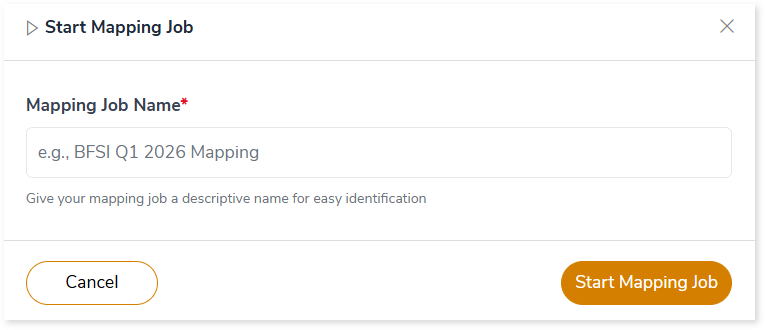
- In the Start Mapping Job dialog:
- Enter a Mapping Job Name.
- Click Start Mapping Job.
- After the ontology mapping job is submitted successfully, navigate to the Ontology Alignment page to view the job listed under Mapping Jobs.
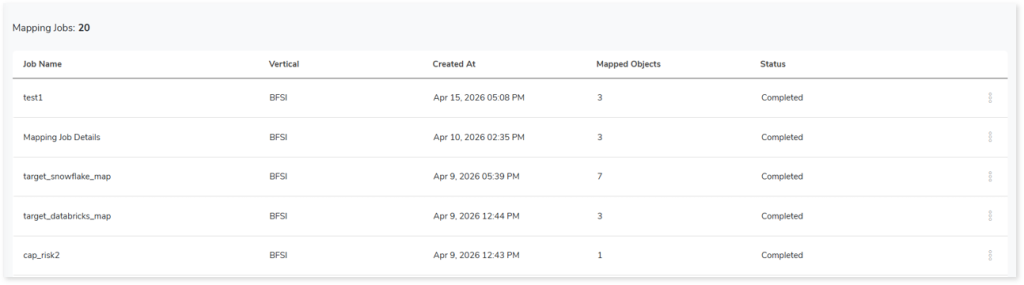
- Once the status changes to Completed, click More actions > View.
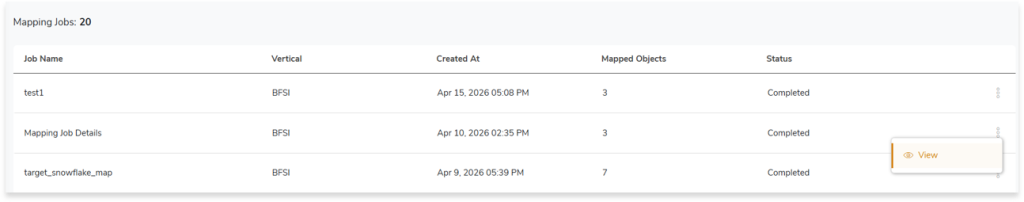
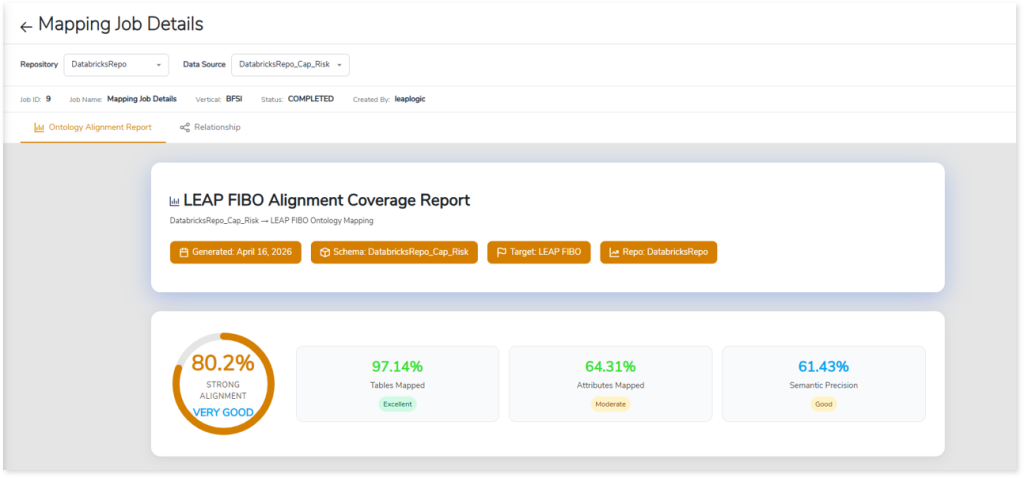
- The Mapping Job Details page opens, displaying the Ontology Alignment Report with mapping insights and results.
Ontology Mapping Report
The Ontology Mapping Report provides a detailed view of ontology alignment results, including the Ontology Alignment Report for coverage, semantic precision, and mapping quality, along with Relationships, which provide a graph‑based representation of the ontology. This view enables you to explore how tables, attributes, and entities are interconnected across the data landscape.
Ontology Alignment Report
The Ontology Alignment Report provides a high-level summary of alignment results, displaying the overall alignment score along with Table/Class Mapping Coverage, Attribute/Property Mapping Coverage, semantic precision, the Improvement Roadmap, and related insights.

Table/Class Mapping Coverage
The Table/Class Mapping Coverage section provides visibility into how enterprise tables are mapped to ontology classes (such as FIBO), summarizing table level alignment and overall coverage. This view enables you to quickly assess semantic adoption and identify gaps in coverage.
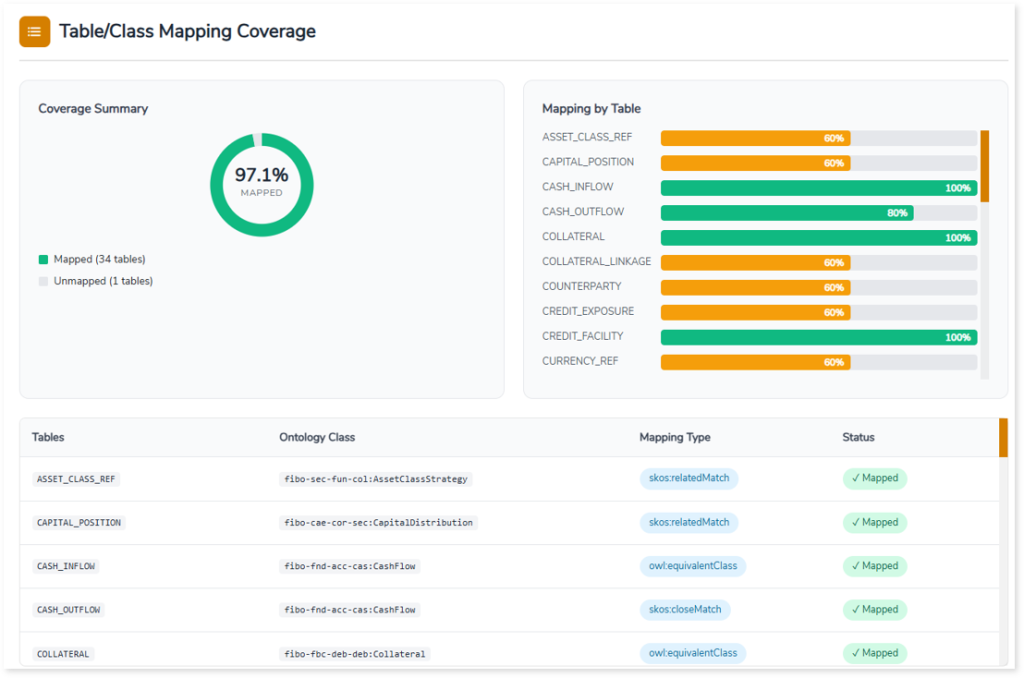
The section includes:
- Coverage Summary, showing the percentage of tables that are mapped versus unmapped.
- Mapping by Table, which highlights individual table‑level coverage to indicate how completely each table is aligned with ontology classes.
- Detailed Mapping Information, listing enterprise tables mapped to corresponding ontology classes, along with the mapping type and the mapping status.
These insights help you evaluate alignment completeness, understand table-level semantic coverage, and identify areas that may require further mapping or improvement.
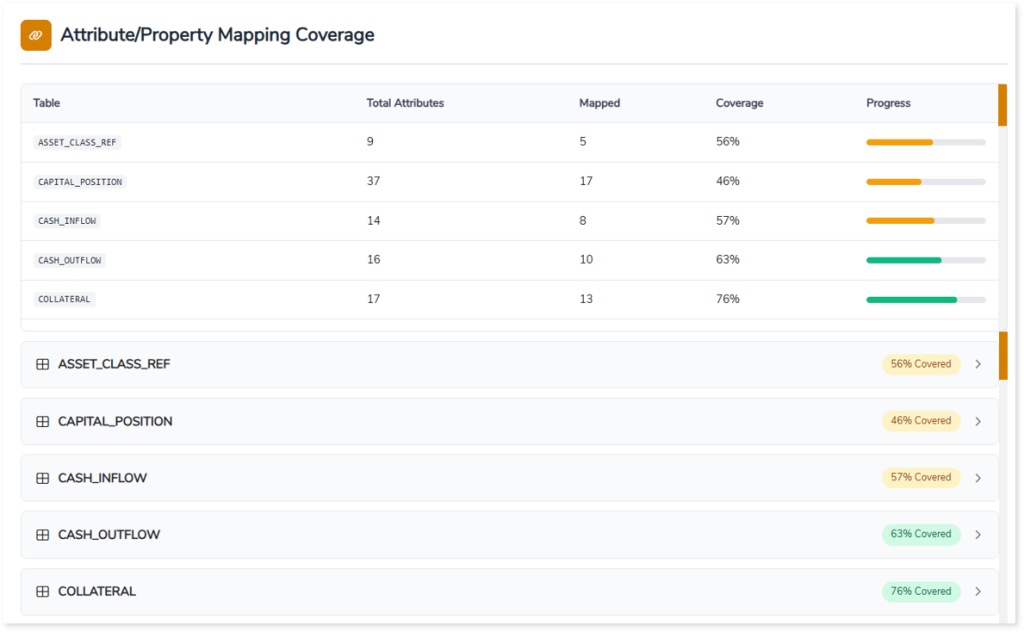
Attribute/Property Mapping Coverage
The Attribute/Property Mapping Coverage section provides visibility into how table attributes are mapped to ontology properties. It summarizes attribute level alignment by displaying the total number of attributes, mapped attributes, coverage percentages, and progress indicators for each table. This view enables you to quickly gauge the depth of semantic standardization across datasets.
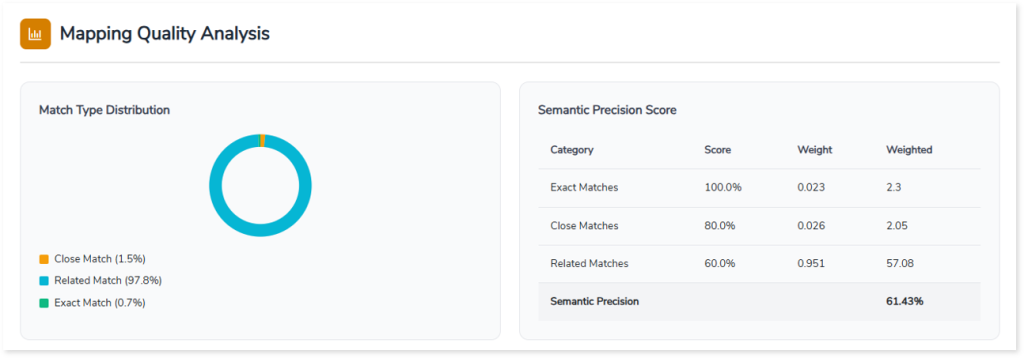
Mapping Quality Analysis
The Mapping Quality Analysis section provides insight into the quality and accuracy of ontology mappings by analyzing how enterprise metadata aligns with ontology concepts. It presents the distribution of match types—such as exact, close, and related matches—and calculates an overall Semantic Precision Score.
The Semantic Precision Score section displays each match category along with its associated match score, assigned weight, and weighted contribution, helping you understand how different levels of semantic alignment contribute to overall mapping quality.
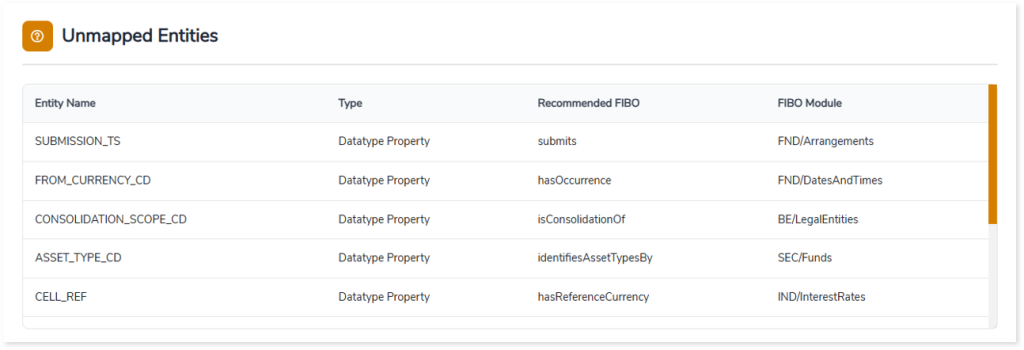
Unmapped Entities
The Unmapped Entities section highlights enterprise entities that have not been mapped to the selected ontology during the alignment process. It lists unmapped tables or attributes along with their entity type and provides recommended ontology concepts (for example, FIBO properties or classes) to guide potential mappings.
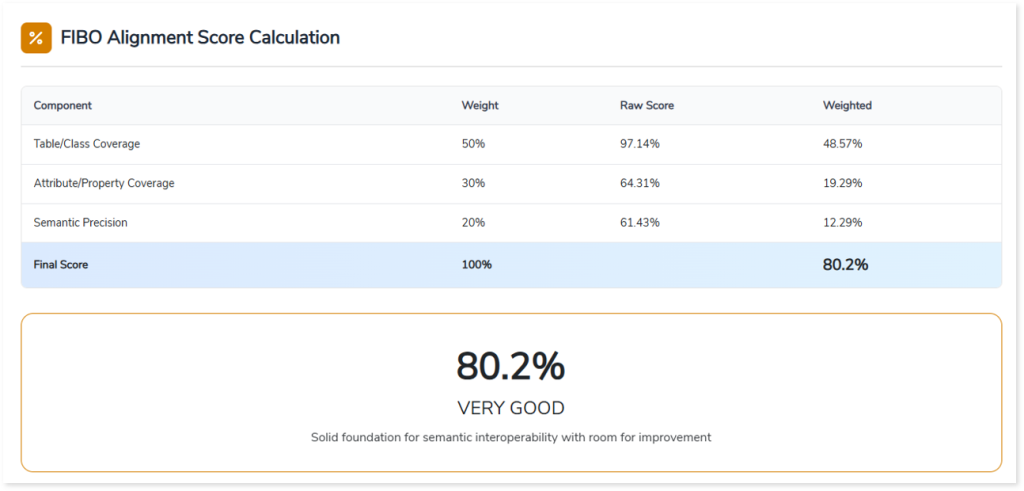
FIBO Alignment Score Calculation
The FIBO Alignment Score Calculation section consolidates ontology alignment results into a single, enterprise-ready score by combining Table/Class Coverage, Attribute/Property Coverage, and Semantic Precision. Each component is weighted to reflect its relative importance in achieving standardization.
The final FIBO Alignment Score provides a clear, quantitative measure of semantic maturity. It enables you to assess overall alignment readiness, benchmark progress across datasets, and identify areas that require further optimization.
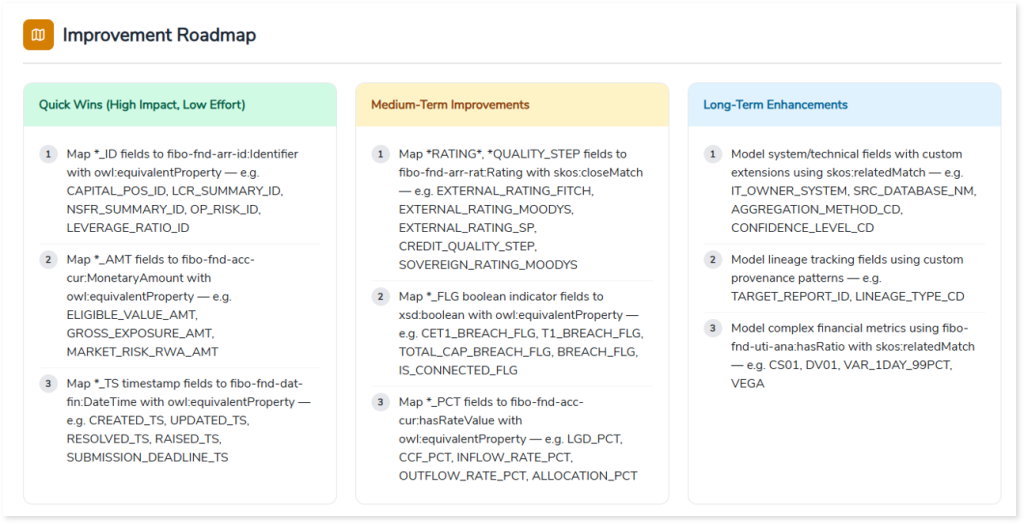
Improvement Roadmap
The Improvement Roadmap presents a structured set of recommendations to improve ontology alignment, organized into Quick Wins, Medium Term Improvements, and Long-Term Enhancements. Each category highlights specific actions to address gaps in coverage, accuracy, and semantic depth. By providing targeted recommendations for mapping identifiers, financial attributes, technical fields, and complex metrics, it helps you systematically improve coverage, precision, and overall semantic maturity in a phased, actionable manner.
FIBO Modules Referenced
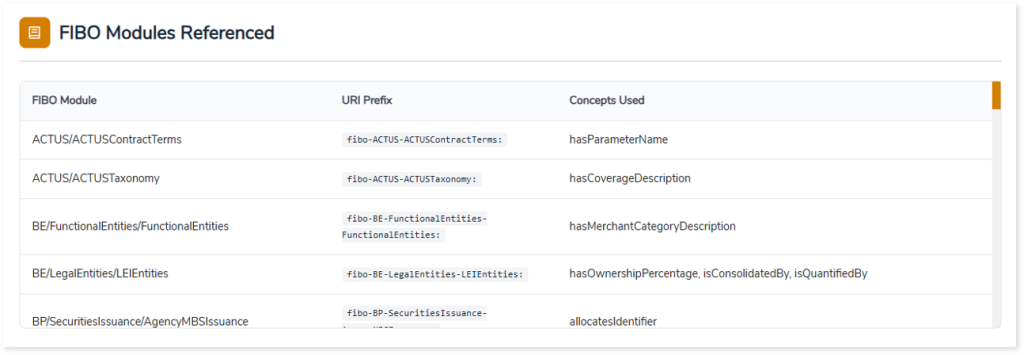
The FIBO Modules Referenced section lists the Financial Industry Business Ontology (FIBO) modules used during ontology alignment. It provides visibility into the specific ontology modules, their URI prefixes, and the business concepts or properties referenced in the mapping process.
This view helps you understand which FIBO modules contribute to the alignment, how enterprise metadata is mapped to standardized ontology concepts, and where each referenced concept resides within the overall FIBO structure.
Relationships
The Relationships view provides a graph-based representation of the ontology, enabling you to explore how tables, attributes, and entities are interconnected across the data landscape. It highlights dependencies and associations, offering a deeper understanding of how data elements relate within the semantic model.
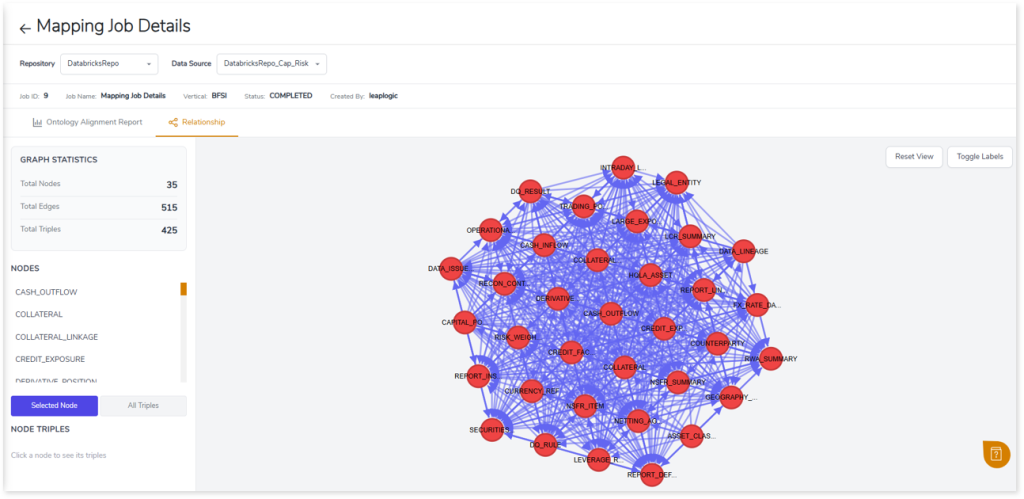
Each node in the graph represents an enterprise data entity or ontology concept, while edges represent semantic relationships and mappings established during ontology alignment.
The Relationships view also includes:
- Graph Statistics, which summarize the total number of nodes, edges, and triples in the graph.
- Nodes Panel, which displays the set of nodes associated with the currently selected node, allowing you to focus on its immediate semantic relationships.
- Node Triples View, which shows detailed subject predicate object relationships for the selected node to support deeper semantic analysis.
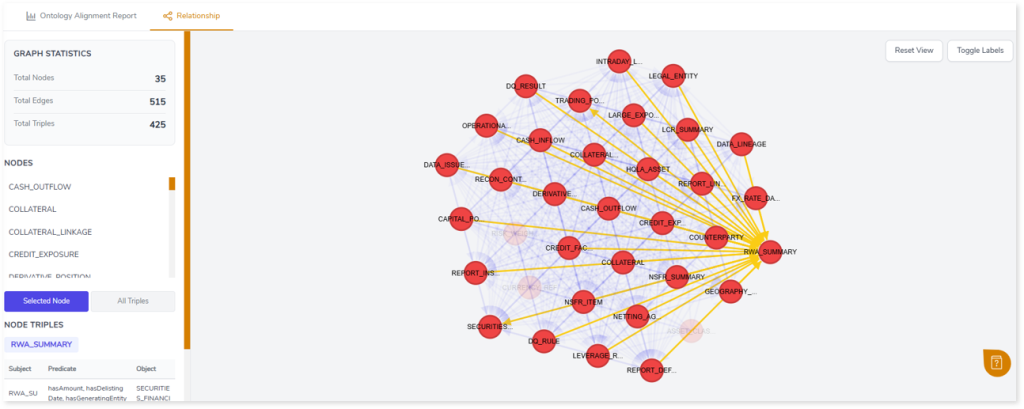
By selecting nodes, you can explore their connected entities, which helps you understand contextual relationships, analyze dependencies, and validate ontology mappings within the semantic model.