Databricks Notebook Lineage Report
The Databricks Notebook Lineage Report provides insights into data flows and dependencies within the Databricks Notebook target environment. It helps you understand how data assets—such as tables, views, and components—are related after data modernization. The supported input file formats for Databricks Notebook lineage are IPYNB, CSV, and PY.
In This Topic:
Lineage
End-to-end data and process lineage identify the complete dependency structure through interactive and drill-down options to the last level.
Typically, even within one line of business, multiple data sources, entry points, ETL tools, and orchestration mechanisms exist. Decoding this complex data web and translating it into a simple visual flow can be extremely challenging during large-scale modernization programs. The visual lineage graph adds tremendous value and helps define the roadmap to the modern data architecture. It deep dives into all the existing flows, like Autosys jobs, applications, ETL scripts, BTEQ/Shell (KSH) scripts, procedures, input and output tables, and provides integrated insights. These insights help data teams make strategic decisions with greater accuracy and completeness. Enterprises can proactively leverage integrated analysis to mitigate the risks associated with migration and avoid business disruption.
Now, let’s see how you can efficiently manage lineage.
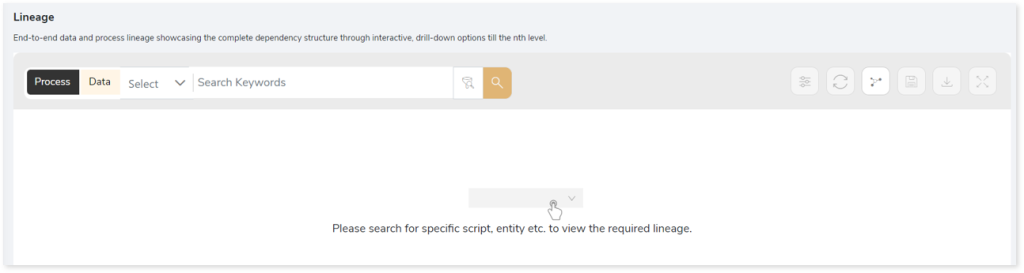
To view the required lineage:
- Select either the Process or Data tab to enable process or data lineage respectively.
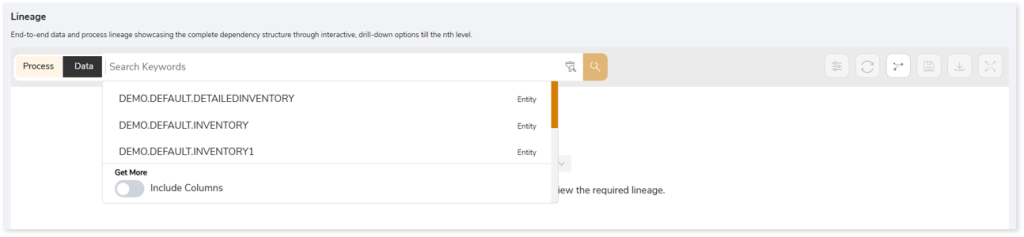
- Enter the keywords in the Search Keywords field you want to search. Else, simply select the entities, Lakehouse files, etc., from the Search dropdown.
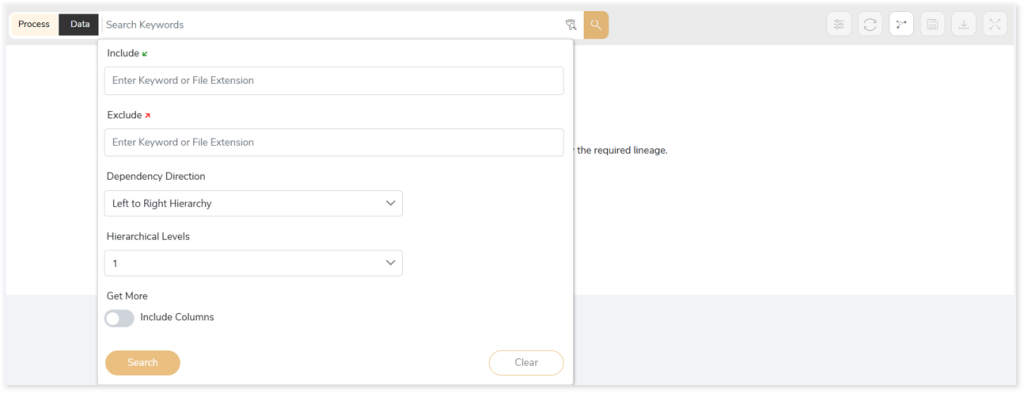
- To generate column-level lineage, turn on Include Columns toggle (available only in Data Lineage).
- Click the Search icon to generate the lineage.
Lineage helps you understand dependencies across processes, tables, and columns:
- Process lineage illustrates the dependencies between two or more processes such as files, orchestration dependencies, workflows, etc.
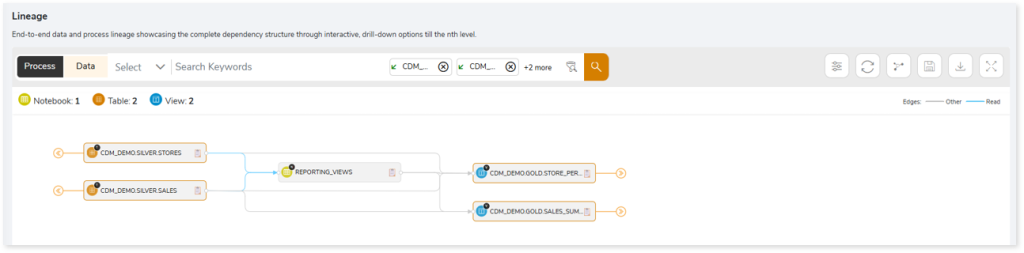
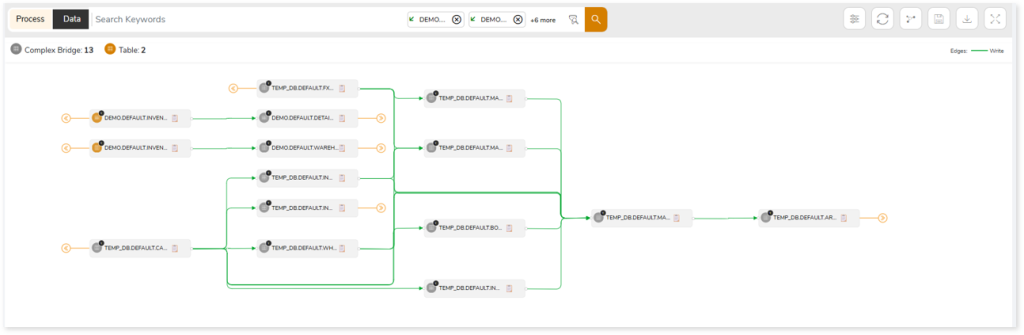
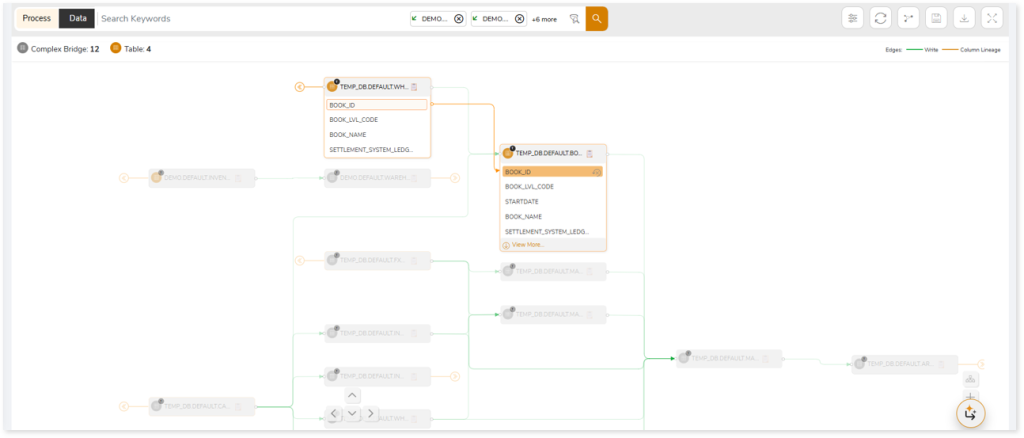
- Data lineage depicts the table-level dependencies and column-level dependencies–input tables, output tables, and reference tables.
- Column-Level lineage shows granular transformations and updates at the minutest level.
In addition, the filter search icon allows you to include or exclude particular nodes to obtain the required dependency structure. It helps you quickly narrow down complex dependency graphs to focus on the exact nodes, relationships, or data flows you want to analyze. Instead of navigating through an entire lineage network, you can apply filters based on object names, types, or relationship categories—making it easier to isolate specific tables, workflows, or transformation paths. This feature enhances traceability, reduces visual clutter, and enables you to precisely identify upstream or downstream dependencies that are most relevant to your analysis or migration scope.
You can also choose the direction of the lineage. By default, the Dependency Direction is Left to Right Hierarchy. This insight is useful to identify and analyze upstream data connections and relationships. You can also choose Right to Left Hierarchy – most useful for how data is getting consumed through the downstream route and which are the participating tables and columns, or Bidirectional dependency direction to visualize both kinds in a single view.
Moreover, you can also increase the Hierarchy Levels to nth level. This again allows great freedom to visualize the end-to-end hierarchy in one go.
Lineage facilitates you visualize how your selected nodes are connected and depend on each other. The nodes and their connecting edges (relationships) help you to understand the overall structure and dependencies.
|
Nodes |
Edges |
 Tables Tables |
 Call Call |
 File File |
 Read Read |
 View View |
 Execute Execute |
 Complex Bridge Complex Bridge |
 Write Write |
 Notebook Notebook |
 Others Others |
Highlights
The Highlights section provides a high‑level overview of the assessment results for the selected workloads. It includes a graphical representation of job and query complexity, along with a summary of the analyzed files.
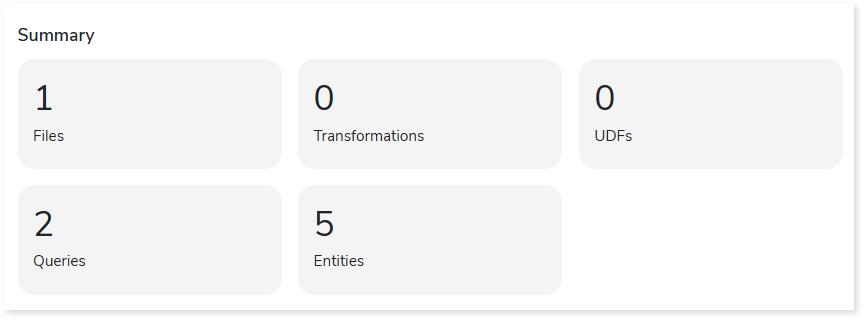
Summary
This section provides an overview of the source files and their workload landscape. It includes details about transformations, entities, queries, and other key components involved in the assessment.
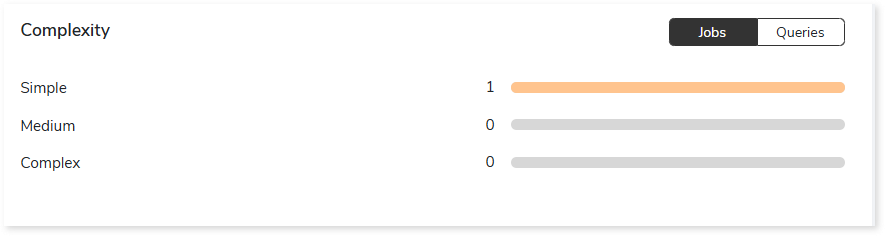
Complexity
This section provides information about the complexity assessment for Databricks Notebook jobs and queries.
Downloadable Reports
Downloadable reports allow you to export detailed assessment reports of your source data which enables you to gain in-depth insights with ease. To access these assessment reports, click Reports.

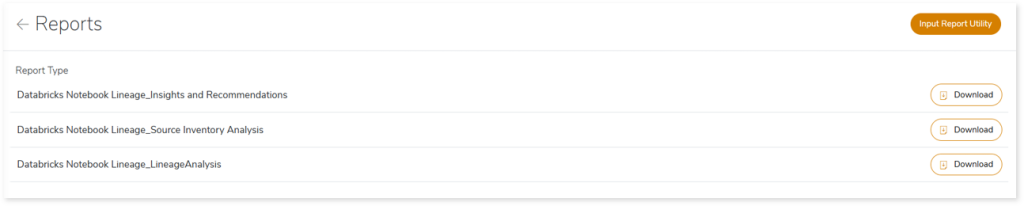
Types of Reports
In the Reports section, you can see various types of reports such as Insights and Recommendations, Source Inventory Analysis, and Lineage Analysis reports. Each report type offers detailed information allowing you to explore your assessment results.
Insights and Recommendations
This report provides an in-depth insight into the source input files. It contains the final output including the details of jobs, complexity, files, variables, and so on.
Databricks Notebook Report.xlsx: This report provides insights about the source inventory. It helps you plan the next frontier of a modern data platform methodically. It includes information about aggregated inventory, jobs, files, variables, and more.
Source Inventory Analysis
It is an intermediate report which helps to debug failures or calculate the final report. It includes all the generated csv reports.
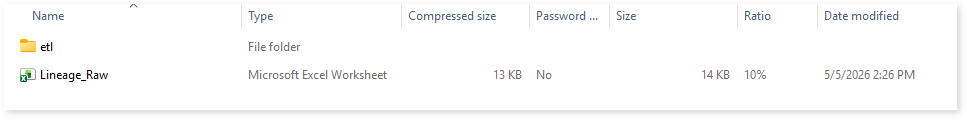
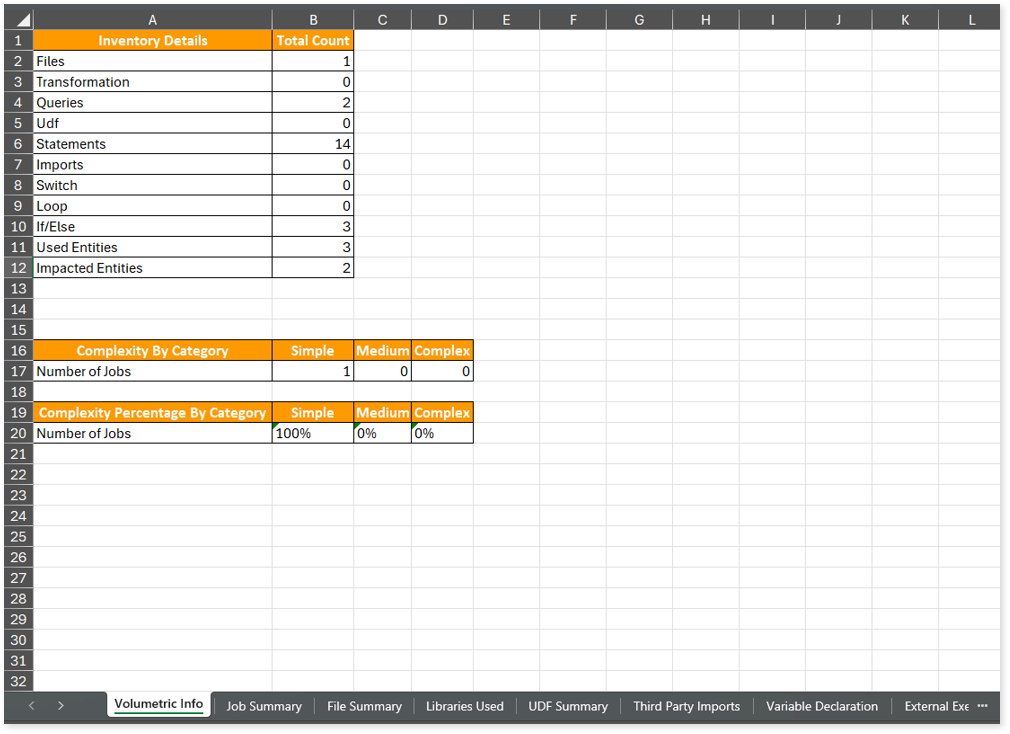
Lineage_Raw.xlsx: This report provides complete dependency information for all nodes and provides an end-to-end view of both data and process lineage. It helps you identify the overall dependency structure and trace data flow across components.
This report contains the following information:
- Volumetric Info: Provides volumetric information about the artifact types including tables, notebook, and views.
- Nodes: Lists all the source and target nodes along with their type. Each node represents a data object in the lineage—such as a table, notebook, etc.—making it easier to trace how data is consumed, transformed, and processed across the workflow.
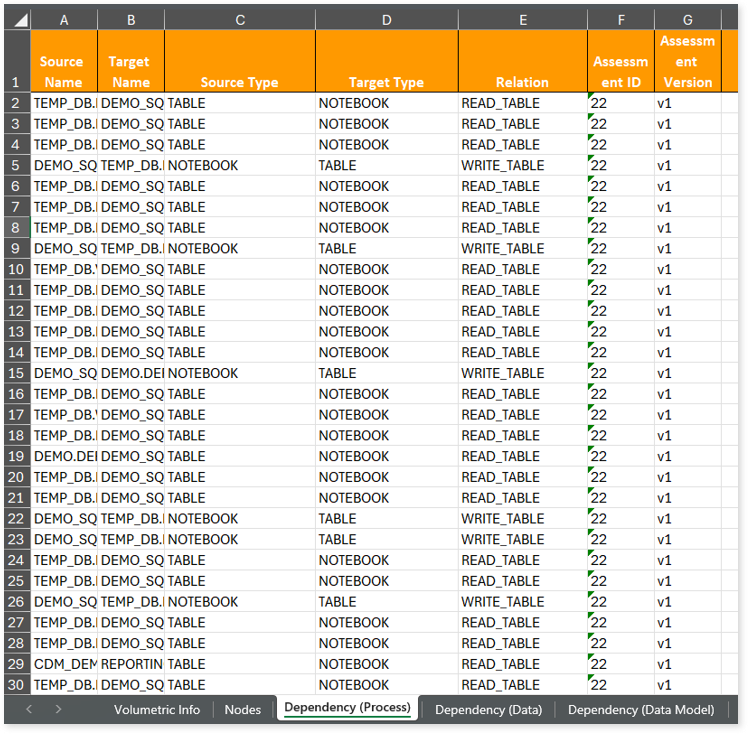
- Dependency (Process): Provides information about the process lineage. It offers detailed visibility into interdependencies between processes—such as notebook, tables, and orchestration steps—helping you understand how they are connected within the workflow.
- Dependency (Data): Provides information about the data lineage. It captures detailed table-level—including input tables, output tables, and reference tables—offering end-to-end visibility into how data flows and transforms across the workflow.
- Dependency (Data Model): Provides dependency details about the data models. It highlights the end-to-end relationships and dependencies between model elements, helping you understand structure and trace linkages.
To access various outputs such assessment_unparsed_files, file summary, missing artifacts, and more, navigate through the etl > notebook folders.

assessment_unparsed_files.csv: This report lists all the unparsed files along with the reason for parsing failure.
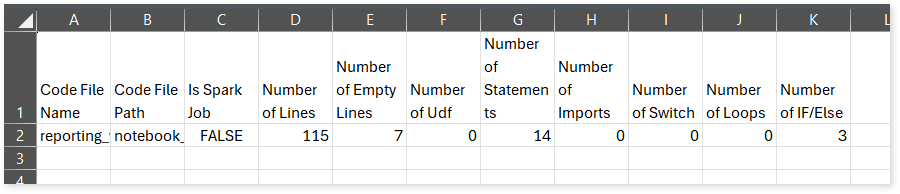
File Summary.csv: This report provides a summary of source files, including the total number of lines, statements, imports, and other key metrics.
Missing Artifacts.csv: This report lists all the missing artifacts.
Lineage Analysis
This section provides lineage-related reports, including entity_link.csv, entity_report.csv, entity_summary.csv, link.csv, script_report.csv reports.
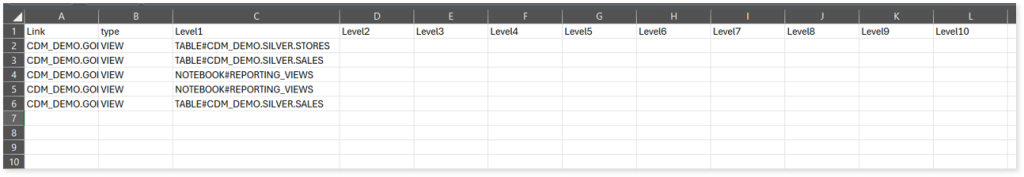
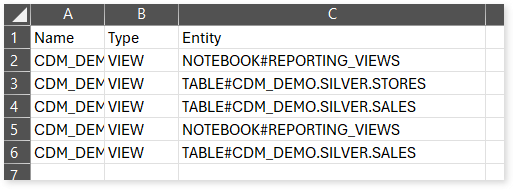
entity_links.csv: This report provides information about how views are connected to entities or tables and how these links extend across multiple levels. Level 1 shows the immediate table to which a view is linked. If that table is further connected to another entity, the next connection appears in Level 2, and so on.
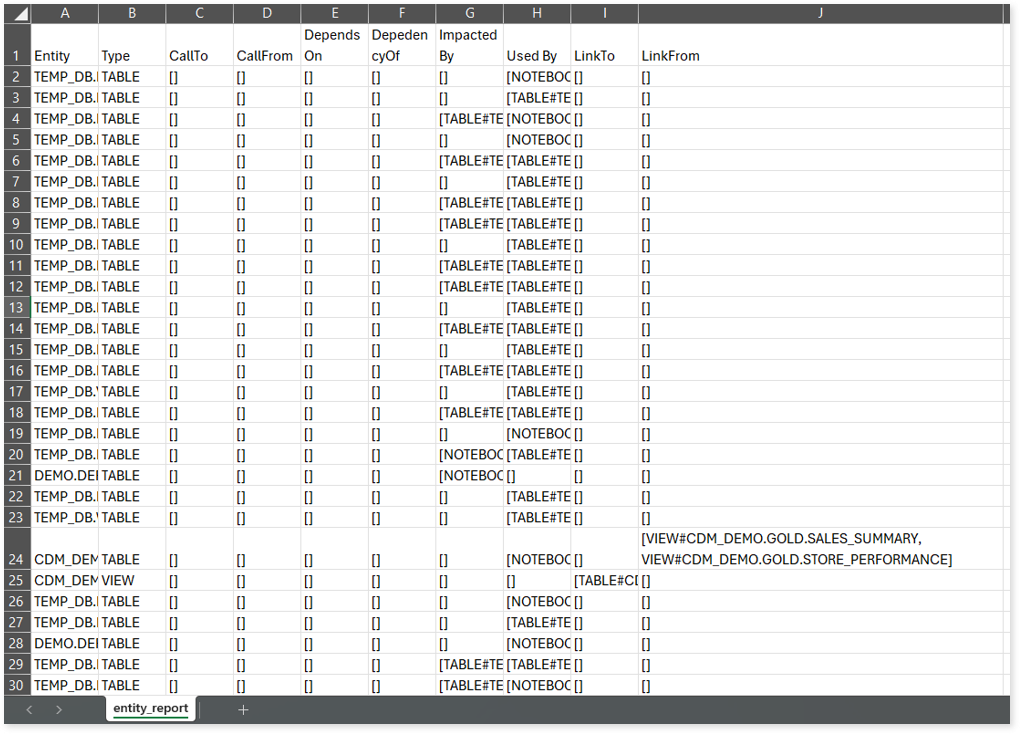
entity_report.csv: This report gives detailed lineage information for each entity in the uploaded source files. It lists all entities along with their types, dependencies, and relationships. The report also shows what each entity depends on, what impacts it, where it is used, and so on.
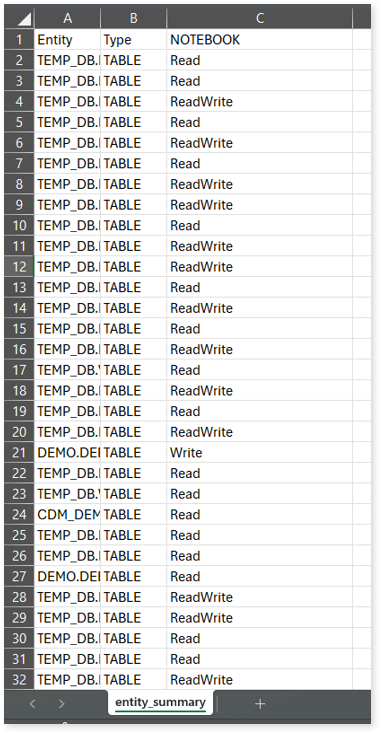
entity_summary.csv: This report provides a list of entities from uploaded source files, indicating where they appear (e.g., Notebook) and the operations performed on them—Read, Write, or ReadWrite.
link.csv: This report provides information about entities linked to each view.
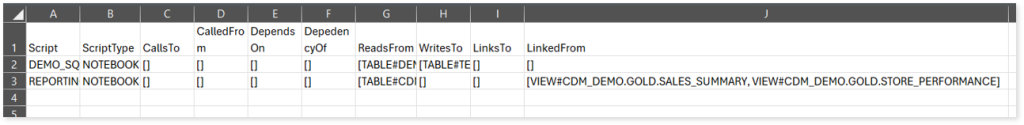
script_report.csv: This report provides detailed lineage information for each script. It lists all scripts along with their type, specifies the processes, entities, or scripts from which each script reads data and those to which it writes, as well as other dependency details.