Analysis
This topic provides a detailed examination of files, orchestration inventory, queries, entities, files, and more. Based on the pre-defined SLAs, cost, resource consumption, etc., the Analysis page shows a glimpse into the most eligible workloads for migration.
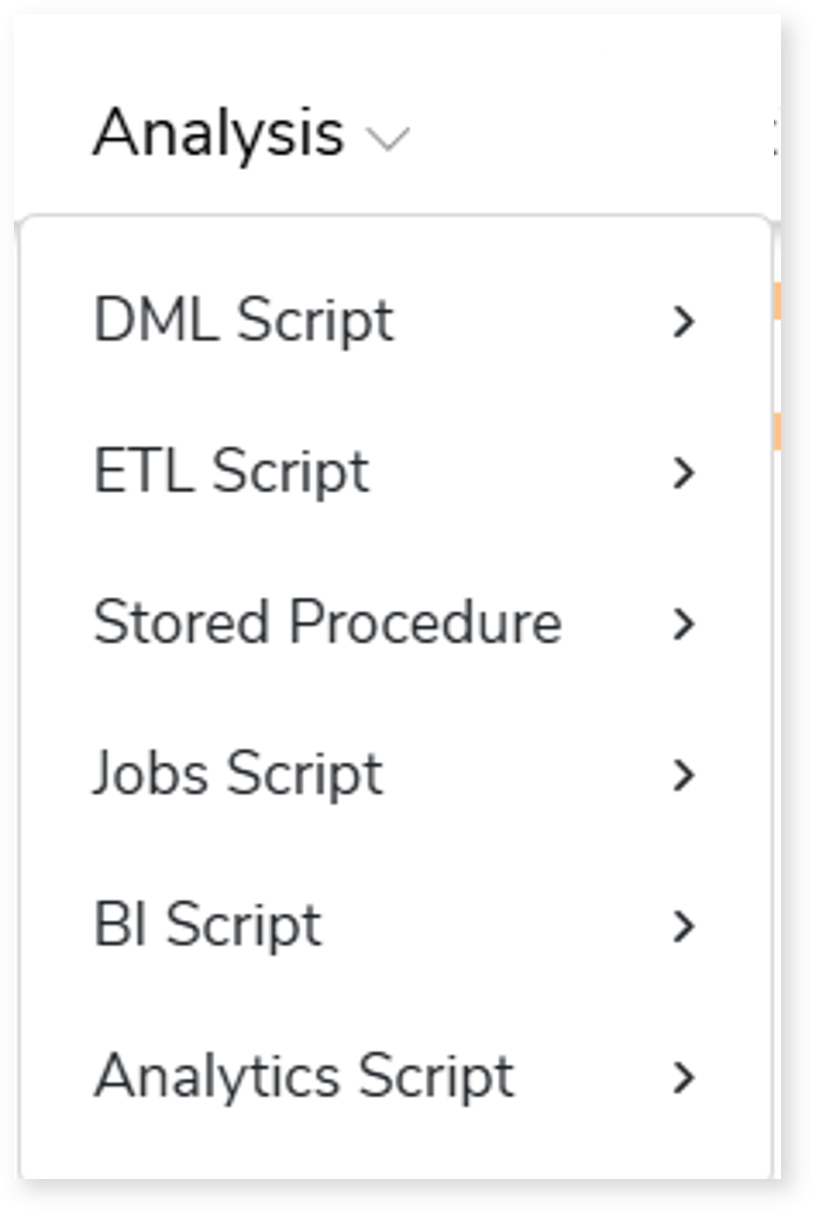
An integrated assessment assesses DML, Stored Procedure, ETL, orchestration, BI, and analytics scripts together as a single assessment. The Analysis section then organizes the assessment results into distinct sub‑sections—such as DML Script, ETL Script, Stored Procedure, Jobs Script, BI Script, and Analytics Script—based on the workload type.
In this Topic:
DML Script
Files
This section provides a comprehensive report of the source files with information about the total number of files, jobs, complexity, and queries associated with each file.
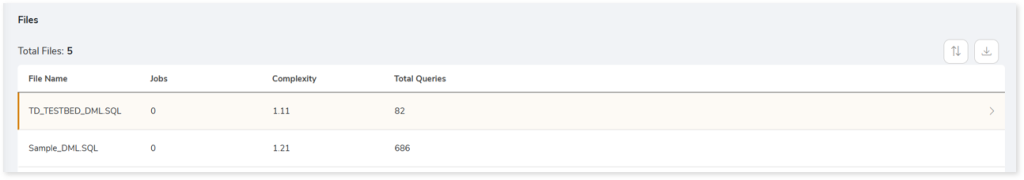
Click the preferred File Name row to gain more insights into the queries present in each file. Here, the queries are categorized into used queries and unused queries.
- Unique Queries: Lists all the unique queries.
- Used Queries: Lists all the used queries. Used queries are queries that are used in both DML scripts and Execution logs.
- Unused Queries: Lists all the unused queries. Unused queries are queries that are used in DML scripts but not in Execution logs.
- Schema Name: Name of the schema.
- Complexity: Provides the complexity of queries.
- Execution Frequency: Provides the frequency of execution.
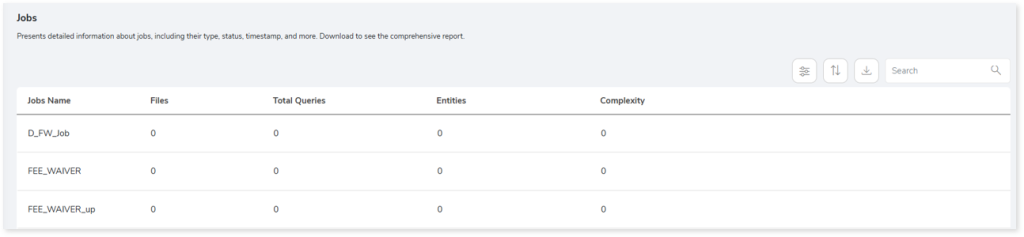
Orchestration Inventory
This section provides a complete analysis of the jobs. Jobs are the orchestration scripts (such as AutoSys, Control-M, or SQL Server) that run in a certain order to perform a set of activities.
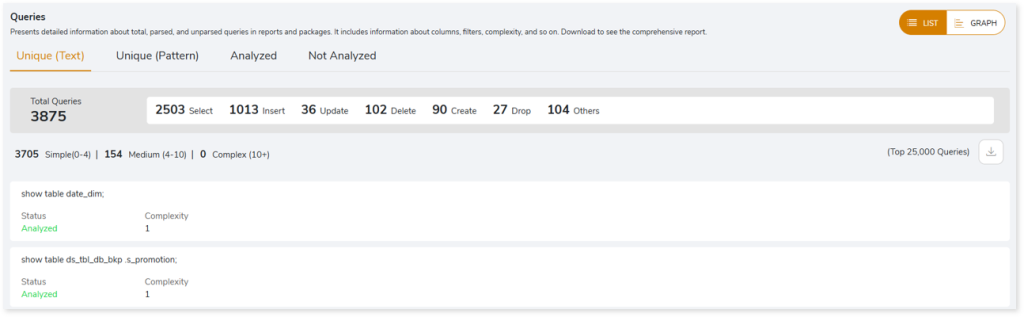
Queries
This page displays graphical (GRAPH) and detailed (LIST) analysis of unique queries, unique patterns, analyzed and not analyzed queries from the total input queries after considering the different SLAs.
Unique (Text)
This section displays a list of all the unique queries. Additionally, it shows the total number of unique queries and the number of queries segregated by the statement type. In Unique (Text), the duplicate queries are eliminated, and solitary queries are identified.
- Status: Displays the query analysis status as Analyzed or Not Analyzed.
- Analyzed: Indicates the query is analyzed.
- Not Analyzed: Indicates the query is not analyzed due to some impediments. If the query status is not analyzed, then it displays the reason for failure.
- Complexity: Displays the query complexity.
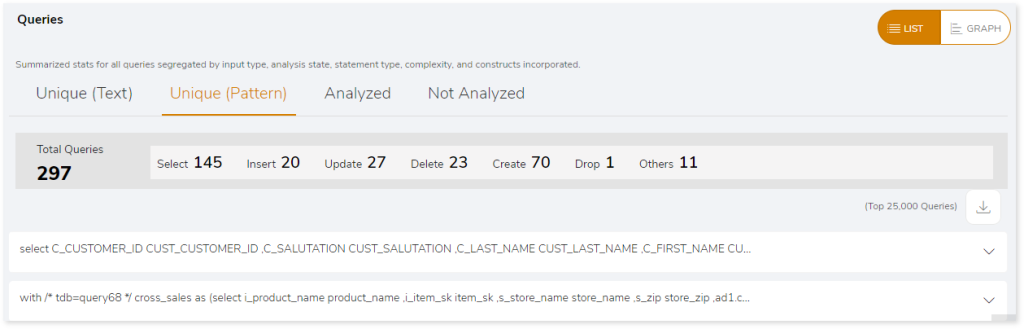
Unique (Pattern)
This section displays a list of all queries with unique patterns. Additionally, it shows the total number of unique pattern queries and the number of queries segregated by the statement type. Unique pattern queries identify the distinct query structures, but the query structure’s values may change.
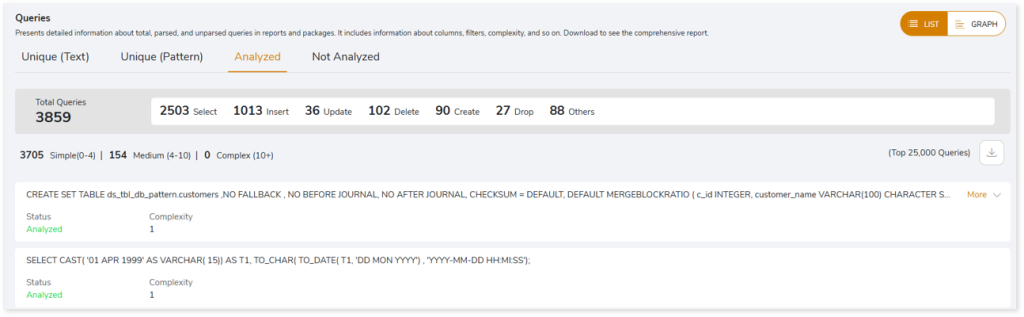
Analyzed
This section displays a list of all queries that meet the analysis criteria. Additionally, it shows the total number of analyzed queries and the number of queries segregated by statement type.
- Status: Displays the query analysis status as Analyzed or Not Analyzed.
- Analyzed: Indicates the query is analyzed.
- Not Analyzed: Indicates the query is not analyzed due to some impediments. If the query status is not analyzed, then it displays the reason for failure.
- Complexity: Displays the query complexity.
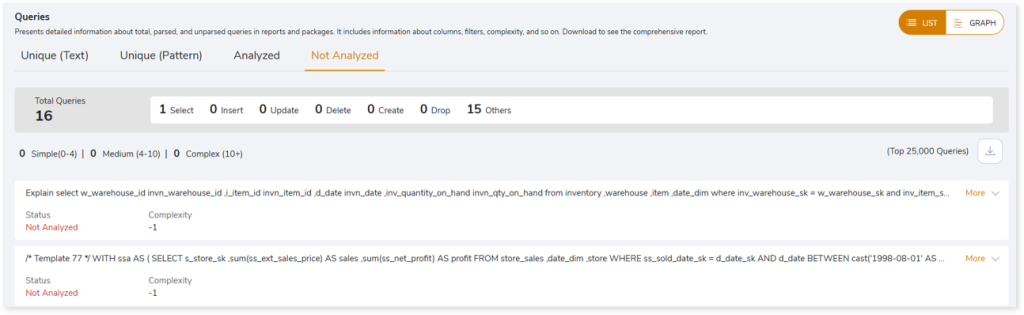
Not Analyzed
This section displays a list of all queries that did not meet the analysis criteria. Additionally, it shows the total number of not analyzed queries as well as the number of queries segregated by statement type.
- Status: Displays the query analysis status as Analyzed or Not Analyzed.
- Analyzed: Indicates the query is analyzed.
- Not Analyzed: Indicates the query is not analyzed due to some impediments. If the query status is not analyzed, then it displays the reason for failure.
- Complexity: Displays the query complexity.
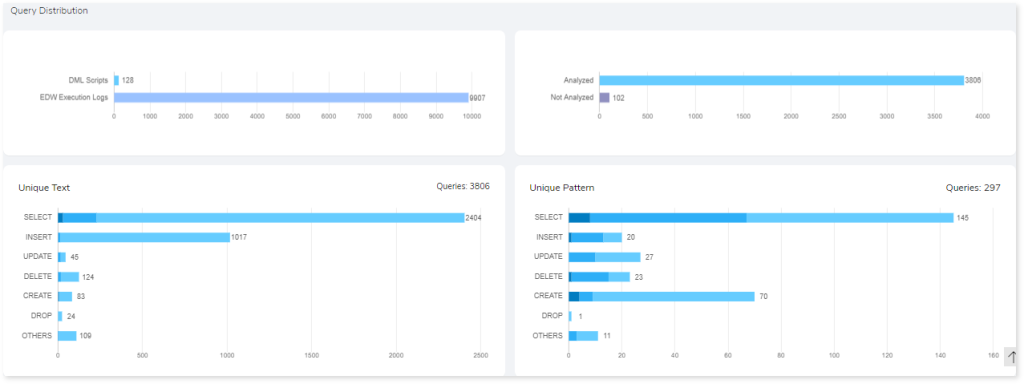
The GRAPH section illustrates a detailed analysis of all queries. It demonstrates query distributions based on unique text, unique pattern, analyzed and non-analyzed queries, etc.
Entities
This section displays graphical (Graph View) and detailed analysis (List View) for the analyzed entities based on the frequency of use and provides information about all the available tables and views used in the queries. Entities are:
- Tables: Encapsulates information about All Tables, Used Tables, Unused Tables, and Missing Tables.
- Views: Contributes information about All Views, Used Views, Unused Views, and Missing Views.
| Entities | Description |
| Tables | All Tables | Total tables available in the source file. |
| Used Tables | Tables which are used in both DML scripts as well as Execution logs. |
| Unused Tables | Tables which are used in DML scripts but not in Execution logs. |
| Missing Tables | Tables which are present in DML scripts but not in DDL scripts. |
| Views | All Views | Total views available in the source file. |
| Used Views | Views which are used in both DML scripts as well as Execution logs. |
| Unused Views | Views which are used in DML scripts but not in Execution logs. |
| Missing Views | Views which are present in DML scripts but not in DDL scripts. |
Tables
Encapsulates information about All Tables, Used Tables, Unused Tables, and Missing Tables.
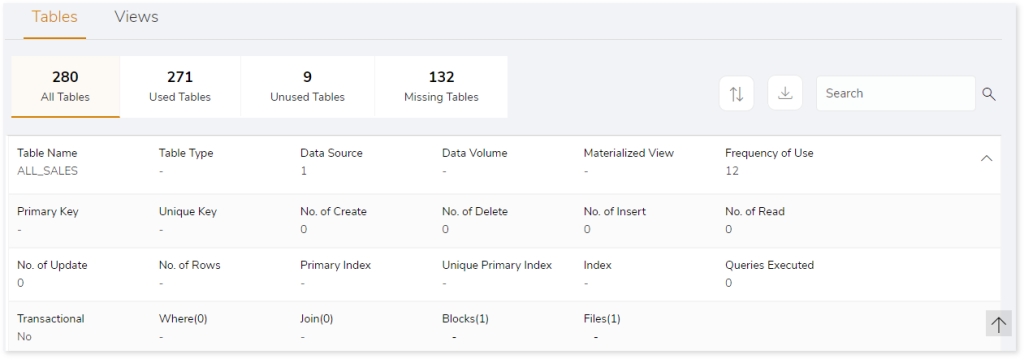
- Table Name: Name of the table.
- Table Type: Type of the table.
- Data Source: Displays details of the data source.
- Data Volume: Displays the quantity of data.
- Materialized View: These are queries used to store data in the physical tables where you can define to update the table automatically when changes are made in the source tables or execute a command to update the tables.
- Frequency of Use: Displays the frequency of table used.
- Primary Key: To identify unique row in the table. It will not accept NULL values.
- Unique Key: To identify records in a table.
- No. of Create: Displays number of CREATE queries in the table.
- No. of Delete: Displays number of DELETE queries in the table.
- No. of Insert: Displays number of INSERT queries in the table.
- No. of Read: Displays number of READ queries in the table.
- No. of Update: Displays number of UPDATE queries in the table.
- No. of Rows: Displays number of rows in the table.
- Primary Index: Indexes based on the primary key.
- Unique Primary Index: Contains unique values in the column of the index table.
- Index: Indexes are lookup tables that help to quickly retrieve data from the database.
- Queries Executed: Number of queries that are executed.
- Transactional: Displays the number of data flow components that are used to perform sorting, merging, data cleansing and so on.
- Where: Displays number of Where clause.
- Join: Displays number of Joins.
- Blocks: Displays number of blocks.
- Files: Displays the name of the associated file.
Views
Lists all the views along with information about the number of used tables and views, databases, details of child tables and views.
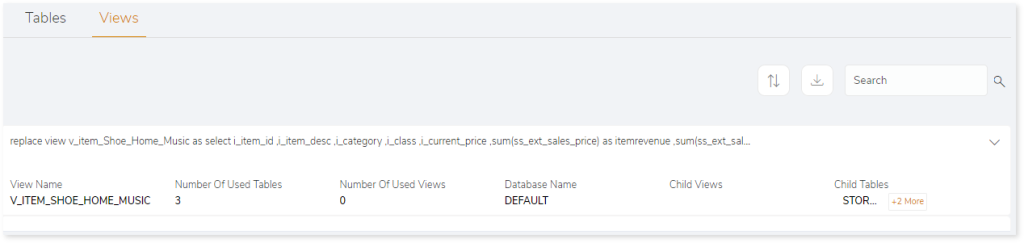
- View Name: Displays the name of the views.
- Number of Used Tables: Displays the number of used tables.
- Number of Used Views: Displays the number of used views.
- Database Name: Provides the name of the databases.
- Child View: Provides details of the child views.
- Child Table: Provides details of the child tables.
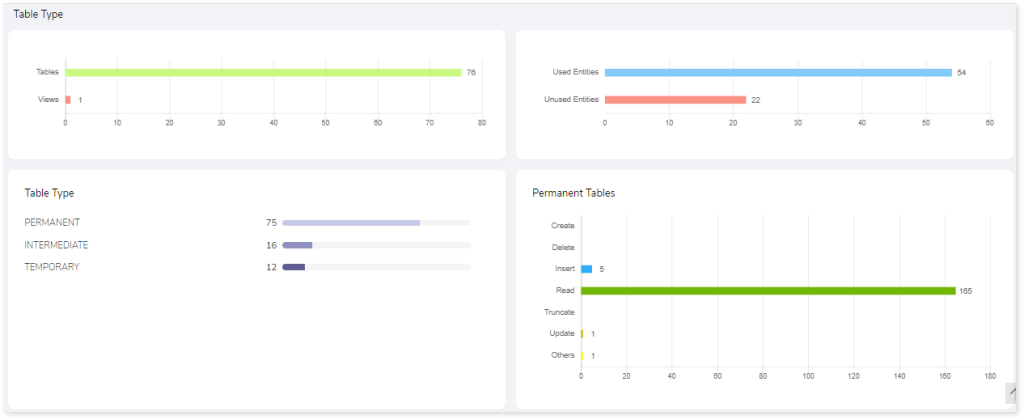
The Graph View of entities displays a graphical illustration of detailed entity analysis after considering different SLAs. In this visual summary, you can see the distribution of tables, views, and entities, as well as information about Permanent, Temporary, or Intermediate table types.
Artifacts
This section lists all the unparsed artifacts. Unparsed artifacts are artifacts that are unable to be parsed by the engine due to some error.
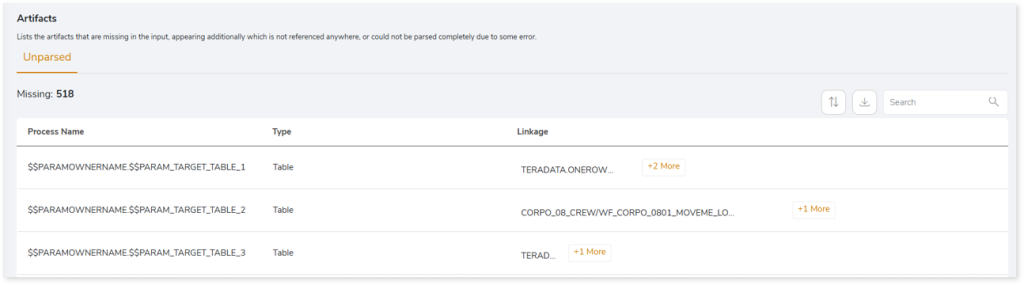
- File Name: Name of the file on which the unparsed query is present.
- Type: Type of the file.
- Linkage: Provides the linked or associated file names.
ETL Script
Source Analysis
This section provides a comprehensive report of the source files with information about the total number of files, source databases, workflows, complexity, external files, and so on.
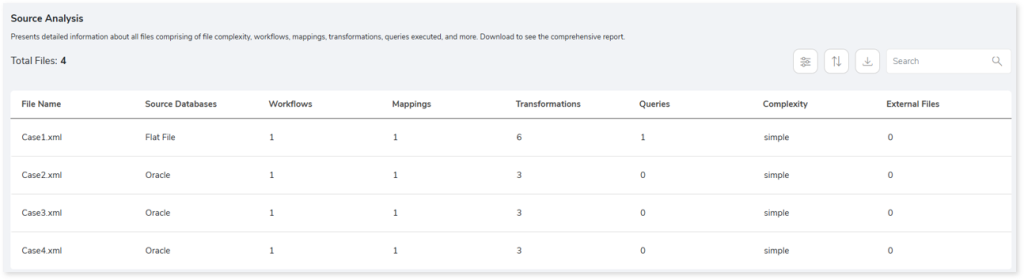
- File Name: Name of the file.
- Source Databases: Provides details about the source database.
- Workflows: Set of instructions to perform various actions.
- Mappings: Describes the flow of data between source and target.
- Transformations: Set of instructions to create, modify, or transform data to the target.
- Queries: Provides the total number of queries in the file.
- Complexity: Displays the complexity of the files.
- External Files: Files other than Informatica files.
Entities
This section displays a detailed analysis of the entities comprising the available and missing tables.
Tables
This section provides details about the tables used in the Lookup transformation, source, and target. The Lookup transformation is used to calculate field values from the source, source qualifier, or target to retrieve required data.
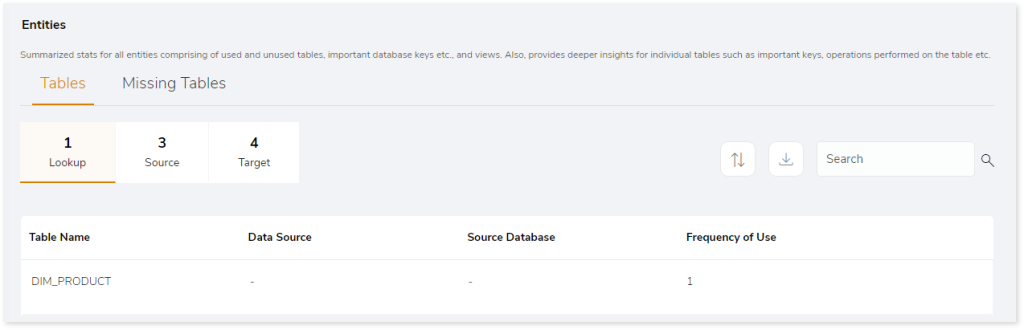
- Table Name: Name of the table.
- Data Source: Provides details of data source.
- Source Database: Provides the details of the source database.
- Frequency of Use: Provides the frequency of table usage.
Missing Tables
This section provides a list of all the missing tables.
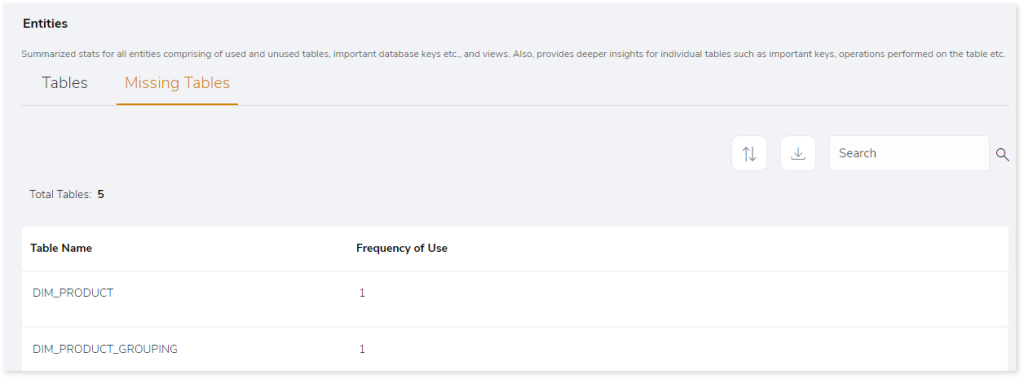
- Table Name: Name of the table.
- Frequency of Use: Provides the frequency of table usage.
Scheduler
This section provides information about the jobs including the types, status, start time, and more.
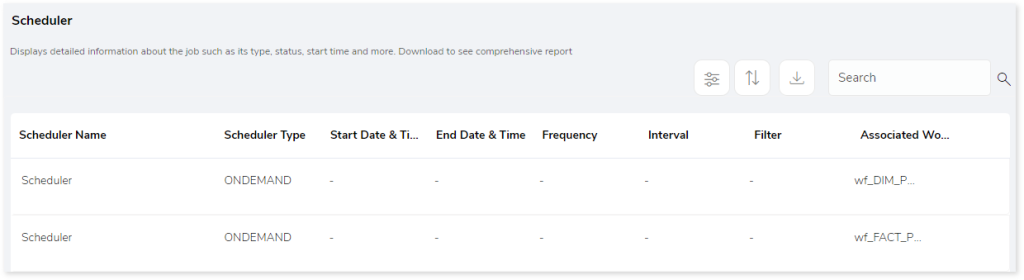
- Scheduler Name: Displays the name of the scheduler.
- Scheduler Type: Displays the type of the scheduler such as On Demand, Continuous, etc.
- Start Date & Time: Displays the job execution start date and time.
- End Date & Time: Displays the job execution end date and time.
- Frequency: Displays the frequency of the scheduled jobs such as daily, weekly, monthly, etc.
- Interval: Displays the frequency interval of the scheduled jobs.
- Filters: To filter the data based on specific requirements. For example: Run the job only for specific geography.
- Associated Workflow: Displays information about the associated workflow.
Workflows
This section provides a summary of workflows with information about mappings, complexity, and associated files.
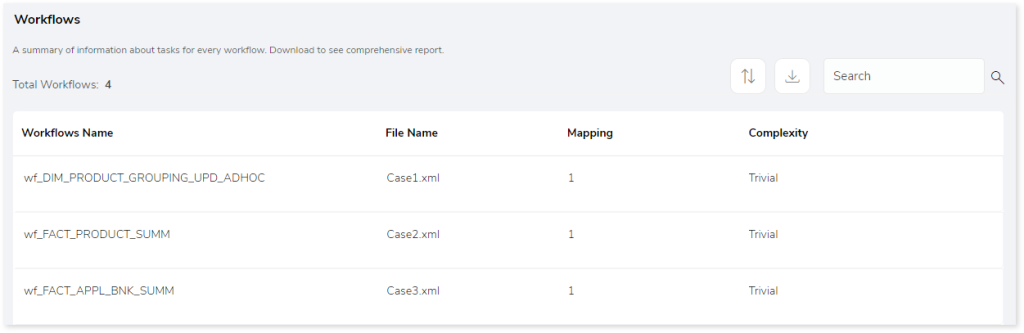
- Workflows Name: Name of the workflow.
- File Name: Displays the associated source file.
- Mapping: Describes the flow of data between source and target.
- Complexity: Displays the complexity of the workflows.
Artifacts
This page gives details about artifacts-collections of the related server data. It provides a list of missing artifacts, artifacts that appear additionally, or could not be parsed completely due to some error.
Missing Artifacts
This section provides the details of all the missing artifacts. Additionally, it categorizes the missing artifacts into files and entities that are missing.This section provides the details of all the missing artifacts. Additionally, it categorizes the missing artifacts into files and entities that are missing.
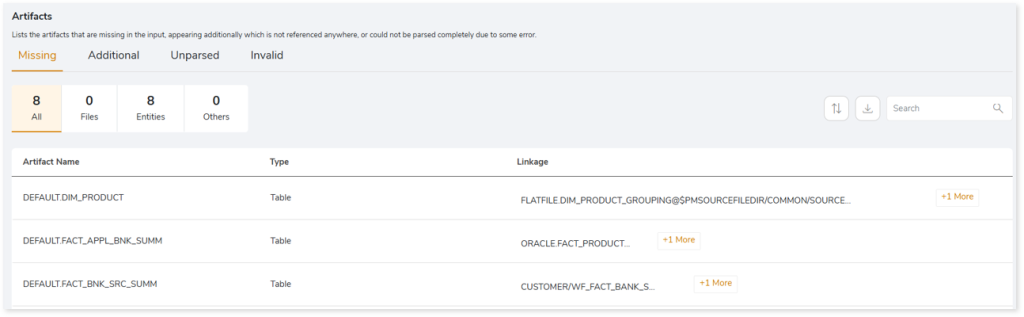
- Artifact Name: Displays name of the artifact.
- Type: Provides the type of the artifacts such as file, table, etc.
- Linkage: Provides the linked or associated file names.
Additional Artifacts
This section provides the details of all the artifacts that appear additionally. It also categorizes the additional artifacts into files and entities.
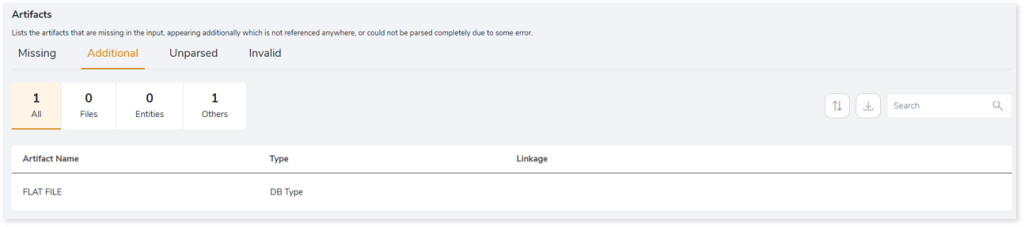
- Artifact Name: Displays name of the artifact.
- Type: Provides the type of the artifacts such as file, table, etc.
- Linkage: Provides the linked or associated file names.
Unparsed Artifacts
This section provides the details of all the artifacts that could not be parsed completely due to some error.
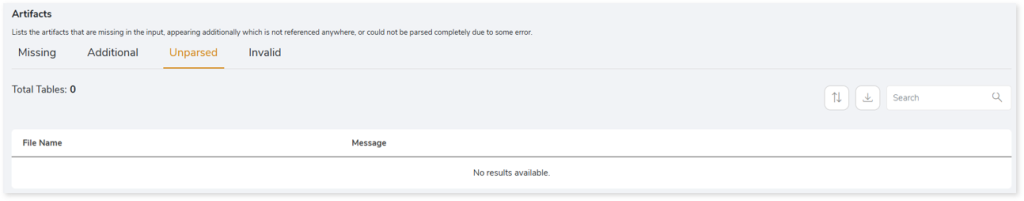
- File Name: Displays the name of the unparsed artifact.
- Message: Displays the reason why the artifact is marked as unparsed.
Invalid
This section lists all the invalid artifacts.
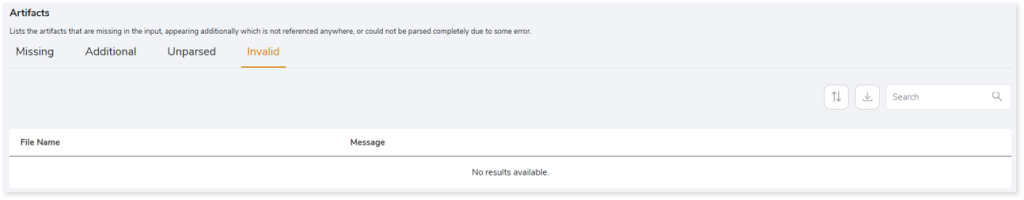
- Message: Displays the reason why the artifact is marked as invalid.
- File Name: Displays the name of the invalid artifact.
Stored Procedure
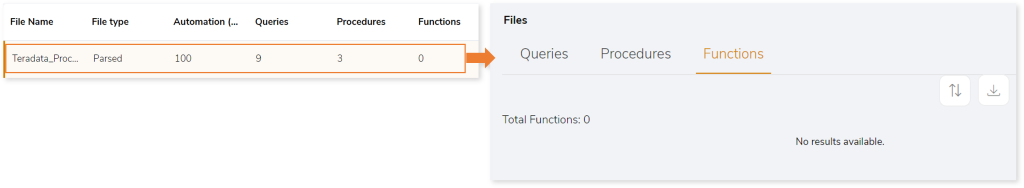
Files
This section provides a list of all the files. Here, the files are categorized into parsed and unparsed files.
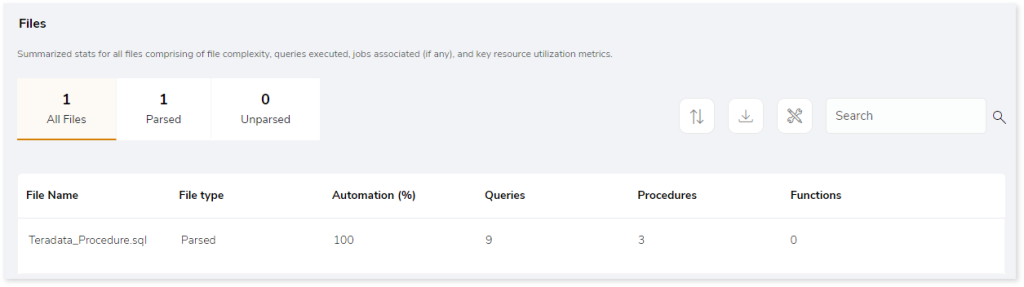
- File Name: Name of the file.
- File Type: Displays the file type as Parsed if the file is parsed, otherwise it displays Unparsed.
- Automation (%): Automation refers to the extent of automated transformation possible for the given source files.
- Queries: Displays the number of queries in the source file.
- Procedures: Displays the number of procedures in the source file.
- Functions: Displays the number of functions in the source file.
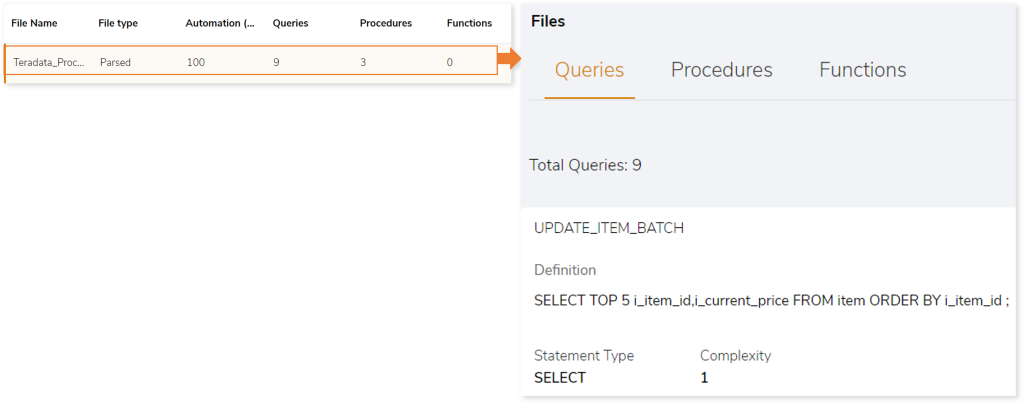
Click the preferred File Name row to gain more insights into the queries, procedures, and functions present in each file.
Queries
Displays a list of queries along with the statement type and query complexity.
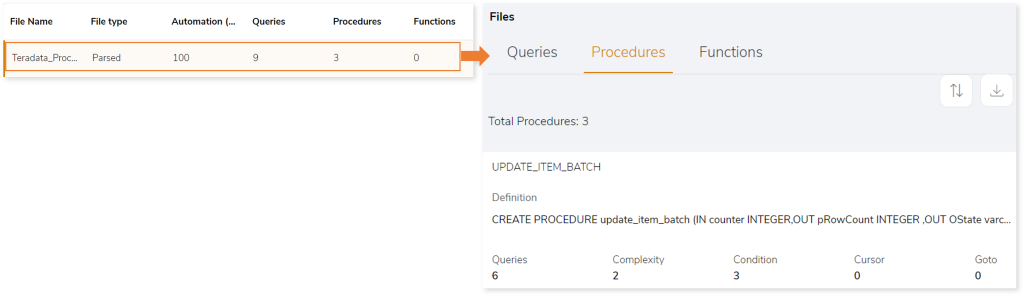
Procedures
Displays a list of procedures which includes details about its content such as condition, cursor, loop, and more.
Functions
Displays a list of functions in the file.
Queries
This page displays information of queries, analyzed, and not analyzed queries.
Queries
Displays all queries segregated by input type, analyzed status, statement type, complexity, and so on.
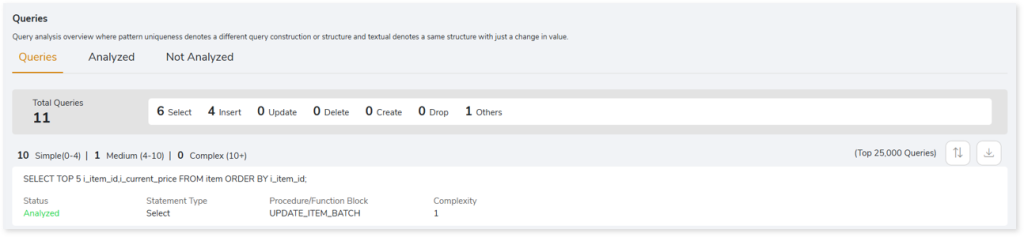
- Status: Displays the query analysis status as Analyzed or Not Analyzed.
- Analyzed: Indicates the query is analyzed.
- Not Analyzed: Indicates the query is not analyzed due to some impediments. If the query status is not analyzed, then it displays the reason for failure.
- Statement Type: Displays the statement type of the query.
- Procedure/Function Block: Displays the procedure or function block information.
- Complexity: Displays the query complexity.
Analyzed
This section displays a list of all analyzed queries. Additionally, it shows the total number of analyzed queries and the number of queries segregated by the statement type.
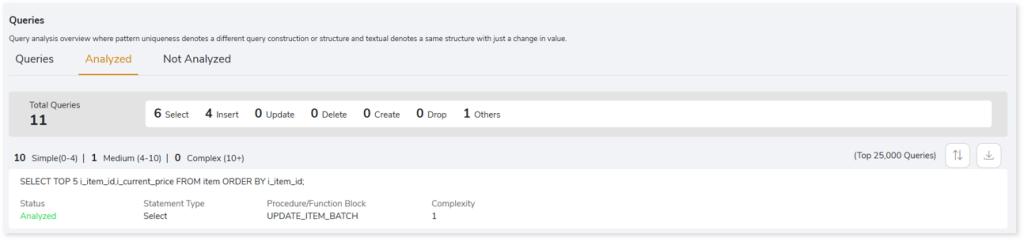
- Status: Displays the query analysis status as Analyzed or Not Analyzed.
- Analyzed: Indicates the query is analyzed.
- Not Analyzed: Indicates the query is not analyzed due to some impediments. If the query status is not analyzed, then it displays the reason for failure.
- Statement Type: Displays the statement type of the query.
- Procedure/Function Block: Displays the procedure/ function block information.
- Complexity: Displays the query complexity.
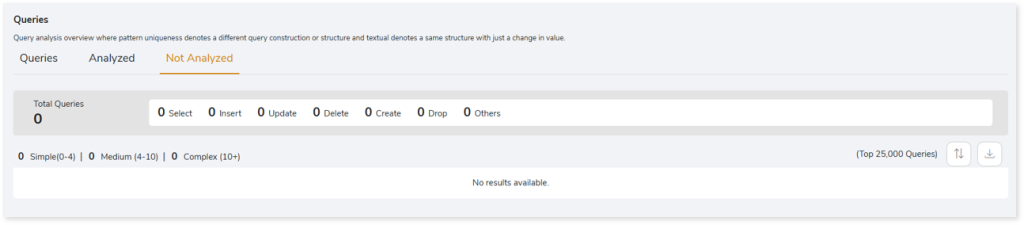
Not Analyzed
This section displays a list of all not analyzed queries. Additionally, it shows the total number of queries that are not analyzed, and the number of queries segregated by the statement type.
Entities
This section displays a detailed analysis for the analyzed entities comprising of used and unused tables, operations performed on the table, frequency of use, procedures, etc.
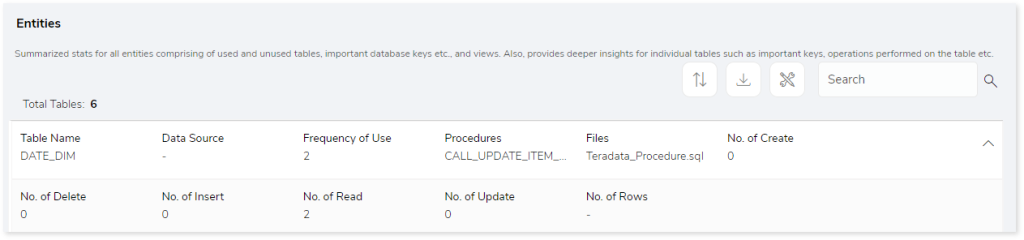
- Table Name: Name of the table.
- Data Source: Displays details of the data source.
- Frequency of Use: Displays the frequency of table used.
- Procedures: Displays the details of procedures.
- Files: Displays the file name which contains the table.
- No. of Create: Displays number of CREATE queries in the table.
- No. of Delete: Displays number of DELETE queries in the table.
- No. of Insert: Displays number of INSERT queries in the table.
- No. of Read: Displays number of READ queries in the table.
- No. of Update: Displays number of UPDATE queries in the table.
- No. of Rows: Displays number of rows in the table.
Artifacts
This section displays all the unparsed artifacts.
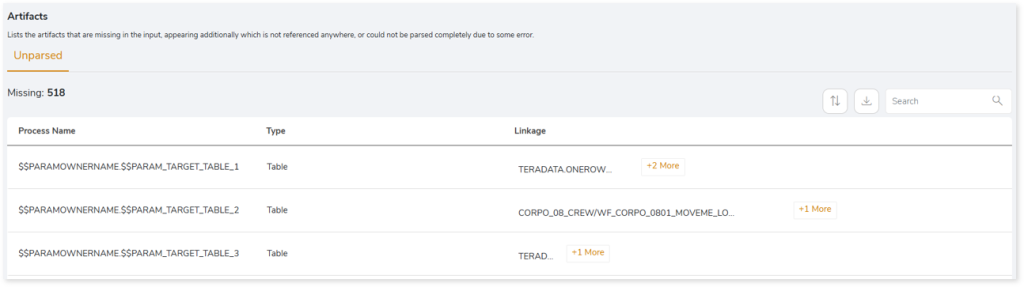
- Artifact Name: Name of the artifact.
- Type: Provides the artifact type such as a file, table, view etc.
- Linkage: Provides the linked or associated file names.
Job Script
Jobs
This section provides a complete analysis of the jobs. Jobs are scheduler scripts (such as AutoSys, Control-M, or SQL Server) that run in a certain order to perform a set of activities. It lists all the jobs along with the information about jobs such as types, status, start time, and more.
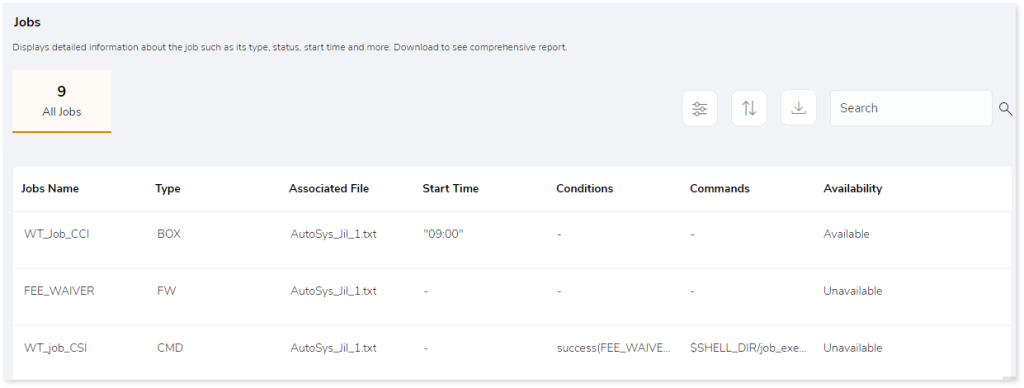
- Jobs Name: Displays the name of the jobs.
- Type: Displays the type of jobs such as box, FW, CMD.
- Associated File: Displays the name of the source scripts that are associated with the jobs.
- Start Time: Displays the job execution time.
- Conditions: Displays the conditions that must be met for a job to run.
- Commands: Displays the commands used in the jobs.
- Availability: Displays the availability of jobs.
- Available: Jobs that are available in both scripts and execution logs.
- Unavailable: Jobs that are available in scripts but not in execution logs.
Artifacts
This section lists all the artifacts that could not be parsed completely due to some error.
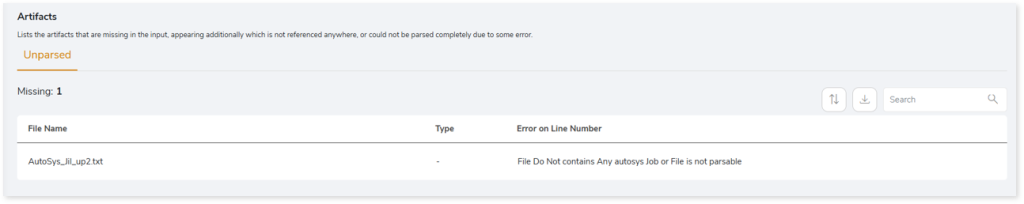
- File Name: Displays name of the artifact.
- Unparsed Message: Displays the reason for not parsing the file.
BI Script
Files
This section provides a comprehensive report of the source file including statistical information about databases, dashboards, and so on along with the complexity of each file.
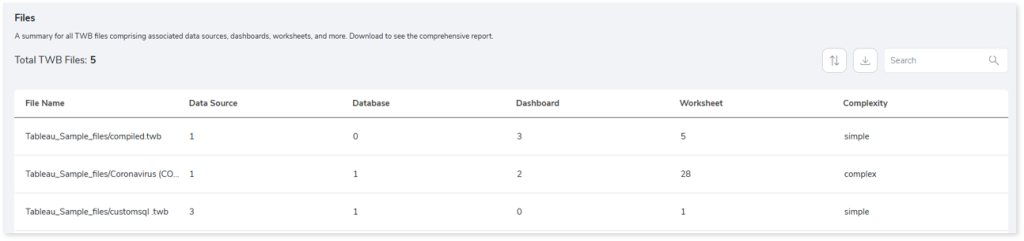
- File Name: Displays the name of each TWB file.
- Data Source: Displays the number of data sources associated with each file.
- Database: Displays the number of databases associated with each file.
- Dashboard: Displays the number of dashboards associated with each file.
- Worksheet: Displays the number of worksheets associated with each file.
- Complexity: Displays the file complexity.
Queries
This section provides a comprehensive summary of queries including unique, analyzed, and unanalyzed queries.
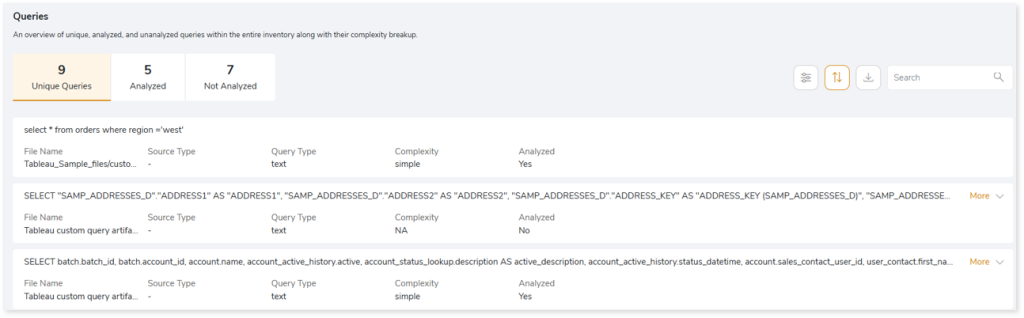
- File Name: Displays the name of the file that contains the query.
- Source Type: Displays the associated source type.
- Query Type: Displays the query type.
- Complexity: Displays the query complexity.
- Analyzed: Displays the query analysis status as Yes or No.
- Yes: Indicates the query is analyzed.
- No: Indicates the query is not analyzed due to some impediments.
Data Sources
This section provides a comprehensive report of the data sources including data sources, type of connections, databases and so on.
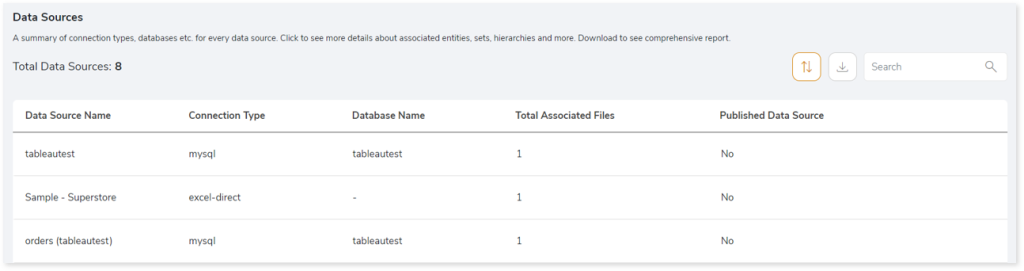
- Data Source Name: Displays the name of the data source.
- Connection Type: Displays the type of the file that is used as source such as mysql, hyper etc.
- Database Name: Provides the name of the database.
- Total Associated Files: Provides the number of the source files associated with the data source.
- Published Data Source: Displays the publication status of the data source. If the value is Yes, it indicates that the data source is published to the Tableau cloud server otherwise, it displays No.
Browse through the data source to get more insights about the associated files.
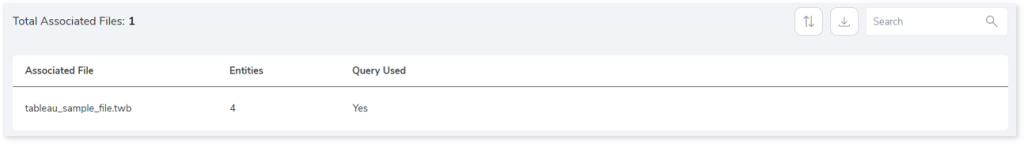
- Associated File: Provides the name of the source files that are associated with the data source.
- Entities: Displays the number of entities.
- Queries Used: Specifies whether queries are executed on the database and the results of those queries are used as connections.
Browse through the required file to get more information about the entities, sets, hierarchy, and relationships
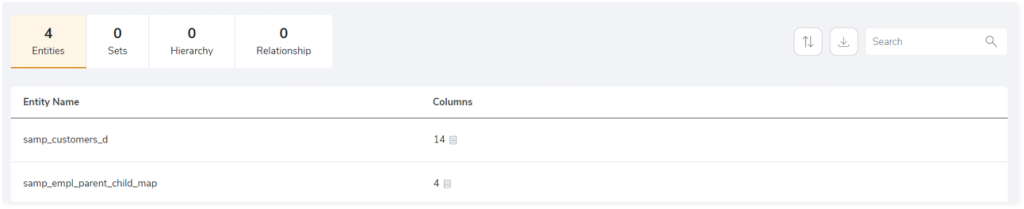
- Entities: Provides details about the entities such as tables.
- Sets: Provides details about sets (group of data or columns).
- Hierarchy: Provides details about hierarchy. (tree-like structure of the columns).
- Relationship: Provides details about the relationship between two entities.
Dashboards
This section provides details about the dashboards including the name of the dashboard, files associated with the dashboard, worksheets and more.
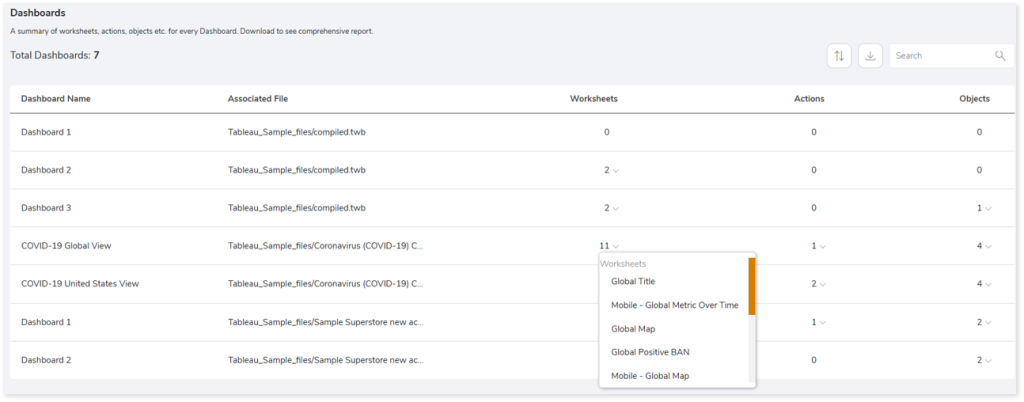
- Dashboard Name: Displays the name of each dashboard.
- Associated File: Displays the files associated with the dashboard.
- Worksheets: Displays the number of worksheets. Worksheets are individual sheets in a workbook that represent data in visual formats such as charts, tables, etc. Click the dropdown arrow next to the worksheets count to view the list of worksheets.
- Actions: Displays the number of actions. Actions are elements added to dashboards or worksheets that allow you to interact with the data such as navigation, etc. Click the dropdown arrow next to the actions count to view the list of actions.
- Objects: Displays the number of objects. Objects are used to perform various actions in the dashboard such as add images, add webpages, add text, etc. Click the dropdown arrow next to the objects count to view the associated objects along with their count.
Worksheets
This section provides details about the worksheets including the name of the worksheet, visualization objects, columns, calculated columns, and more.
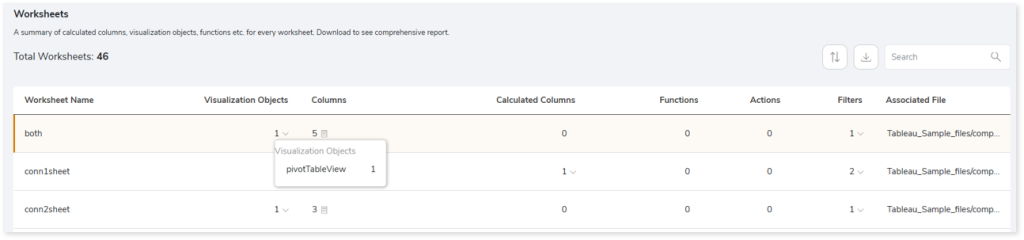
- Worksheet Name: Displays the name of each worksheet.
- Visualization Objects: Displays the number of maps or visualization objects. Click the dropdown arrow next to the visualization objects count to view the list of visualization objects along with their count.
- Columns: Displays the total number of columns used to represent the visuals. Click the dropdown arrow next to the count to view column-specific information such as names, usage types, and more.
- Calculated Columns: Displays the number of calculated columns in each worksheet. Calculated columns are columns that perform calculations using functions such as min, max, sum, avg, etc. Click the dropdown arrow next to the count to view the list of calculated columns.
- Functions: Displays the number of aggregate functions used in the worksheet such as min, max, etc.
- Actions: Displays the number of actions. Actions are elements added to dashboards or worksheets that allow you to interact with data such as navigation, etc.
- Filters: Displays the number of filters used in the worksheet. Click the dropdown arrow next to the count to view the associated filters along with their count.
- Associated Files: Provides the name of the files associated with the worksheet.
Analytics Script
Source Analysis
This section provides a comprehensive report of the SAS script including file complexity, queries executed, and so on. It also shows the number of macros, proc SQL, data steps, etc. for every SAS script.
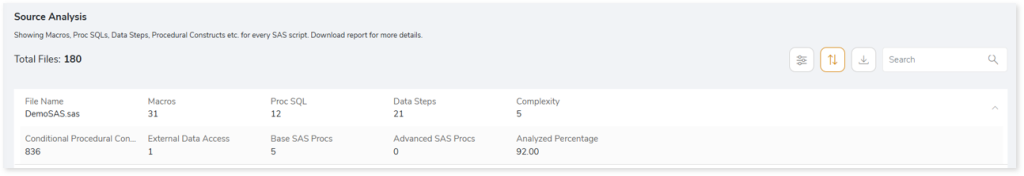
- File Name: Name of the file.
- Macros: Displays the number of macros in the file.
- Proc SQL: Displays the number of Proc SQL in the file.
- Data Steps: Set of instructions to manage (create or modify) data sets.
- Complexity: Displays the complexity of SAS script.
- Conditional Procedural Constructs: Group of conditional statements including do loop statement count, if statement count, where statement count, do over statements count, array statement count, let statement count, put statement count, symdel statement count, and else_cond count.
- External Data Access: Group of statements including lib name statement count, and ods count.
- Base SAS Procs: Procedural statements in SAS including proc append count, proc calendar count, proc catalog count, proc chart count, etc.
- Advanced SAS Procs: Procedural statements in SAS including proc access count, proc aggregation count, proc allele count, proc anom count, proc appsrv count, and more.
- Analyzed Percentage: Percentage of analyzed files.
Artifacts
This page gives details about artifacts-collections of related server data. It provides a list of files that could not be parsed completely due to some error.
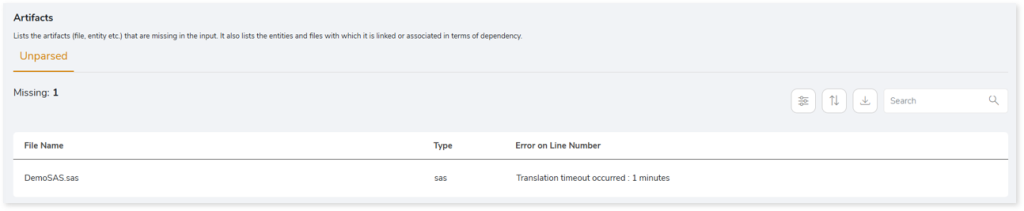
- File Name: Displays the name of the unparsed file.
- Type: Displays the type of each file.
- Error on Line Number: Displays the line number where the error occurred or the error details.