WebFOCUS Assessment Report
This topic contains information about the WebFOCUS assessment report. The assessment assesses workloads and produces in-depth insights that help to plan the migration in a phased manner. The supporting input source files for this assessment includes FEX, MAS, and HTML formats.
In This Topic:
Highlights
The highlights section gives you a high-level overview of your assessment summary of the analytics performed on the selected workloads.
Summary
This section provides an overview of input source files and the associated workload inventory including reports, master files, dashboards, visualizations, and more.
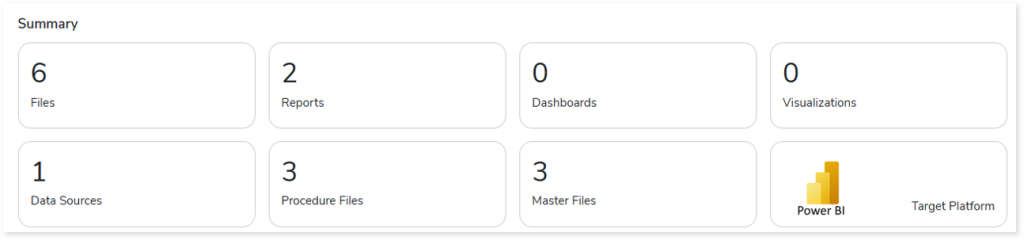
- Files: Displays the number of input files that are parsed successfully, including master, fex (procedure), and HTML files.
- Reports: Displays the number of reports in the entire inventory.
- Dashboards: Displays the number of dashboards in the entire inventory.
- Visualizations: Displays the number of visuals in the entire inventory.
- Data Sources: Displays the number of data sources.
- Procedure Files: Displays the number of procedure files that are parsed successfully.
- Master Files: Displays the number of master files. It contains metadata information of data sources. The supported file format is .mas.
- Target Platform: Displays the name of the target platform.
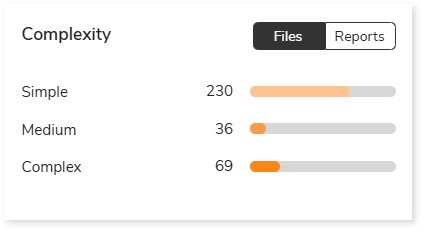
Complexity
This section provides a summarized graphical representation of the complexity of files and reports that helps in making different decisions, including budget estimation and the effort required for migration.
Reports
This section provides details about the total number of reports along with its distribution across various report types.
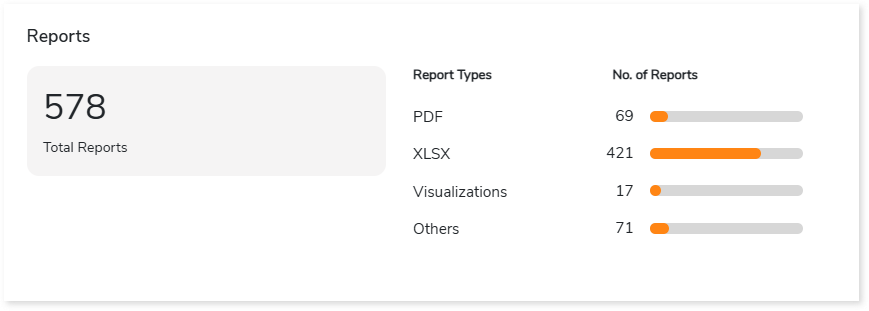
- Total Reports: Displays the total number of reports.
- Report Type: Lists the report types along with the number of associated reports.
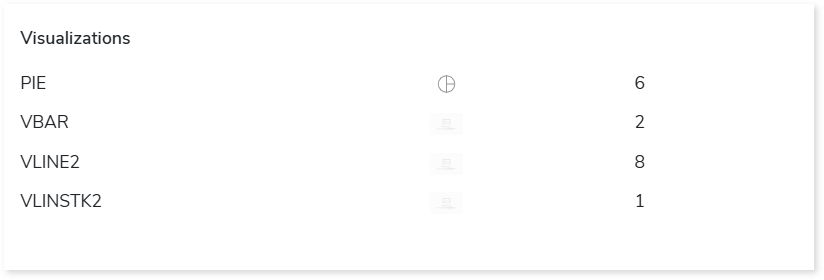
Visualizations
This section provides information about the visuals used in the reports such as bar chart, pie chart, dot graph, area chart, etc.
Queries
This section displays details of the queries including the total number of queries, parsed and invalid queries along with the complexity distribution.
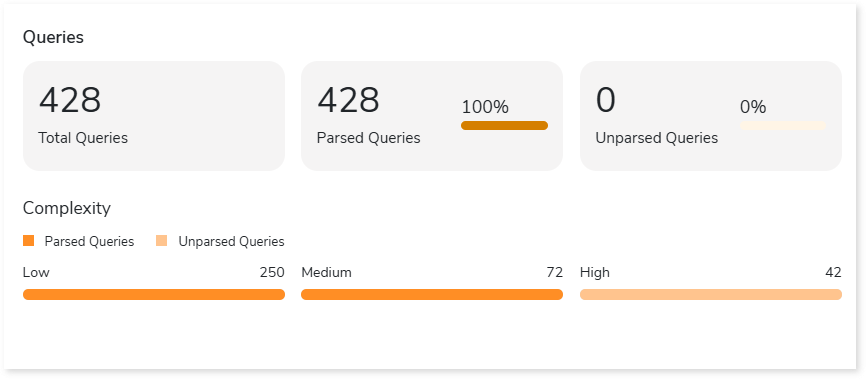
- Total Queries: Displays the total number of queries.
- Parsed Queries: Displays the number of parsed queries.
- Unparsed Queries: Displays the number of unparsed queries.
- Complexity: Displays the query complexity.
Entities
This section displays details of the tables including the total number of tables, used and unused tables along with their distribution across table types.
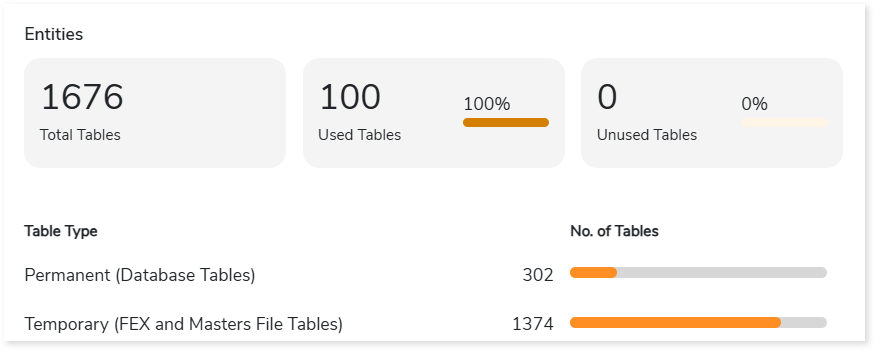
- Total Tables: Displays the total number of tables.
- Used Tables: Displays the number of used tables. Used tables are tables that are used in reports or within other tables.
- Unused Tables: Displays the number of unused tables. Unused tables are tables that are not used in reports or within other tables.
- Table Type: Lists the table types along with the number of associated tables. The different types of tables are:
- Permanent: Tables that are present in the database.
- Temporary: Tables that are present in the master files or intermediate tables present in the FEX (procedure) files.
Master Files
This section provides information about master files including number of columns, calculated columns, folders, and more. The master file contains metadata information of data sources. The supported file format is .mas.
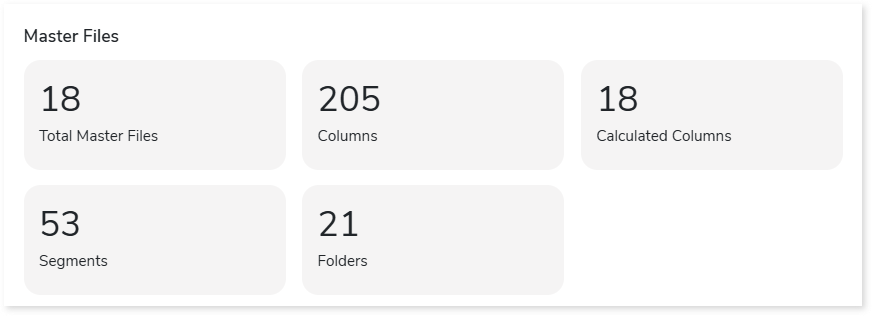
- Total Master Files: Displays the total number of master files.
- Columns: Displays total number of columns present in master files.
- Calculated Columns: Displays number of calculated columns in master files. Calculated columns are columns that are derived from another column.
- Segments: Displays number of segments. Segments are hierarchical structures within the master file that organize and relate data within a dataset.
- Folders: Displays number of folders. Folders organize related items to create a business view, displaying only the required data.
Filters
This section provides an overview of filters within the entire inventory.

- Total Filters: Displays total number of filters in the entire inventory.
Parameters
This section provides an overview of parameters within the entire inventory.
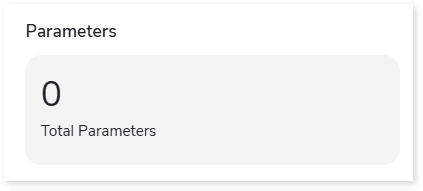
- Total Parameters: Displays total number of parameters in the entire inventory.
Analysis
This topic provides a detailed examination of files, reports, dashboards, queries, entities, and master files.
Files
This section provides a comprehensive report of the source file including file types, reports, data sources, schemas, and dashboards along with complexity.
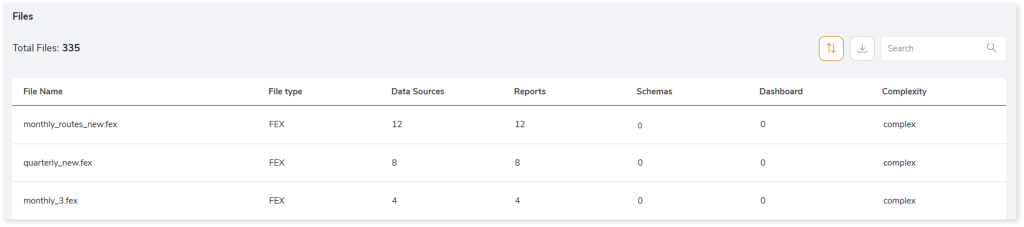
- File Name: Displays the name of the source file.
- File Type: Displays the type of each file.
- Data Source: Displays the number of data sources in each file.
- Reports: Displays the number of reports in each file.
- Schemas: Displays the number of schemas associated with each file.
- Dashboards: Displays the number of dashboards in each file.
- Complexity: Displays the complexity of each file.
Queries
This section provides a comprehensive summary of queries including the total number of queries, and complexity of each query. It also provides information about parsed and unparsed queries.
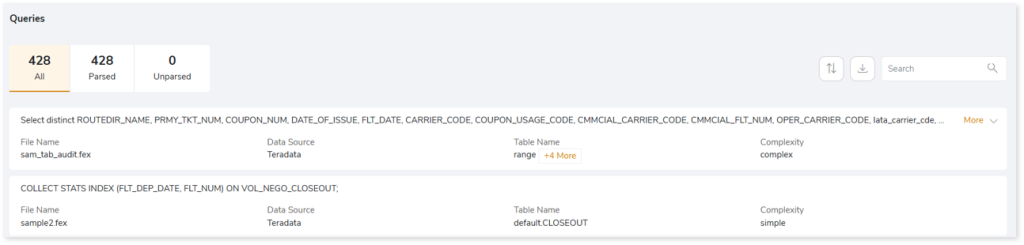
- File Name: Displays the name of the file that contains the query.
- Data Source: Displays the database where queries will be processed.
- Table Name: Displays the table name associated with the query.
- Complexity: Displays the complexity of each query.
Reports
This section provides detailed information about reports, including report formats, master files, complexity, and more.
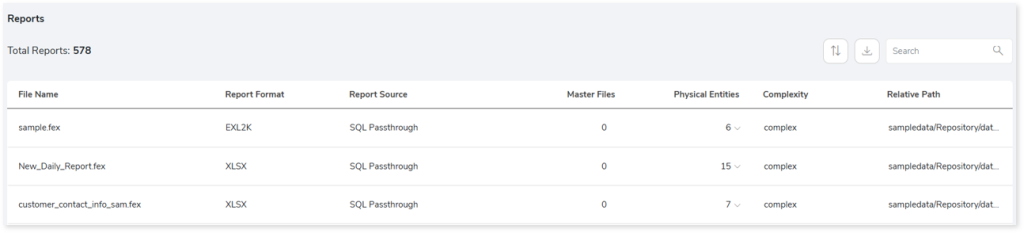
- File Name: Displays the name of the file where the report is present.
- Report Format: Displays the format of each report.
- Report Source: Displays the source of each report. Reports can be generated from either a master file or an SQL file. If a report is created from a master file, it displays “Master File”; if it is created from an SQL file, it displays “SQL Passthrough”.
- Master Files: Displays the number of master files used to create each report. If values are present in this field, then click on the count to view the list of master files.
- Physical Entities: Displays the number of associated physical entities with each report.
- Complexity: Displays the complexity of each report.
- Relative Path: Displays the relative path of each report.
Master Files
This section provides detailed information about master files, including columns, calculated columns, views, segments, and more.
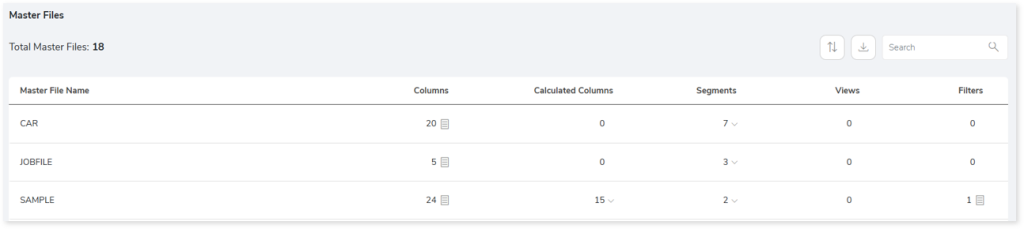
- Master File Name: Displays the name of the master file.
- Columns: Displays the number of columns in each master file.
- Calculated Columns: Displays the number of calculated columns in each master file.
- Segments: Displays the number of segments present in each master file.
- Views: Displays the number of views present in each master file.
- Filters: Displays the number of filters present in each master file.
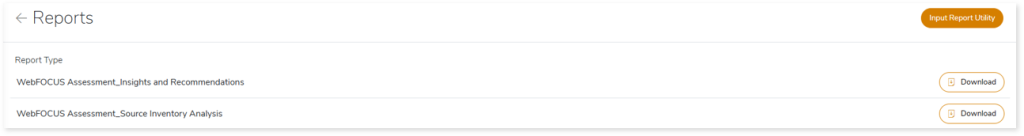
Downloadable Reports
Downloadable reports allow you to export detailed WebFOCUS assessment reports of your source data which enables you to gain in-depth insights with ease. To access these assessment reports, click Reports.

Types of Reports
In the Reports section, you can see various types of reports such as Insights and Recommendations and Source Inventory Analysis. Each report type offers detailed information allowing you to explore your source inventory.
Insights and Recommendations
This report provides an in-depth insight into the source input files. It contains the final output including information about FEX files, master files, FEX graphs, and more.
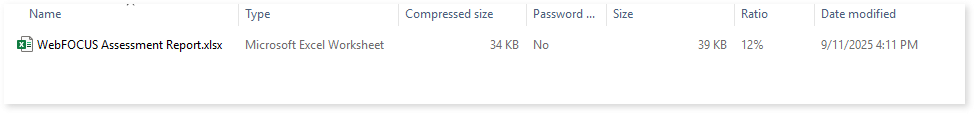
WebFOCUS Assessment Report.xlsx: This report provides insights about the source inventory. It helps you plan the next frontier of a modern data platform methodically. It includes information about FEX files, master files, FEX reports, unparsed files and more.
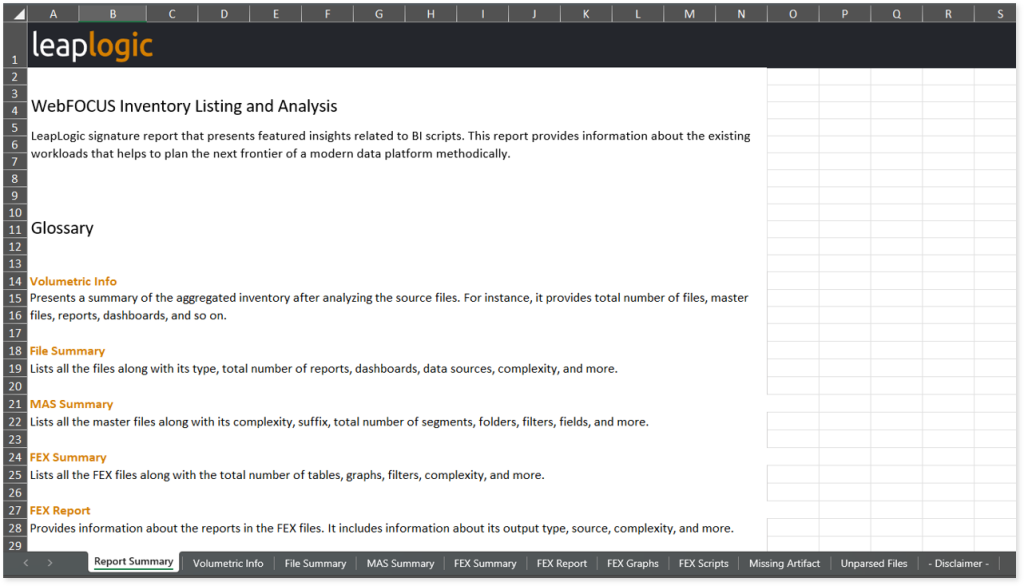
This report contains the following information:
- Report Summary: Provides information about all the generated artifacts.
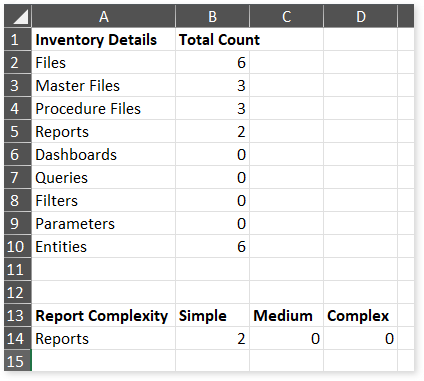
- Volumetric Info: Presents a summary of the aggregated inventory after analyzing the source files. For instance, it provides total number of files, master files, reports, dashboards, and so on.
- File Summary: Lists all the files along with their type, total number of reports, dashboards, data sources, complexity, and more.
- MAS Summary: Lists all the master files along with its complexity, suffix, total number of segments, folders, filters, fields, and more.
- FEX Summary: Lists all the FEX files along with the total number of tables, graphs, filters, complexity, and more.
- FEX Report: Provides information about the reports in the FEX files. It includes information about its output type, source, complexity, and more.
- FEX Graphs: Provides information about the graphs in the FEX files. It includes information about input tables, graph type, output format, complexity, and so forth for each graph.
- FEX Scripts: Provides information about the SQL queries used in each FEX file. It includes information about its query type, connection type, input and output tables, complexity, and more.
- Missing Artifact: Lists all the missing artifacts along with its type.
- Unparsed Files: Lists all the unparsed files along with its type and the reason for failure.
Source Inventory Analysis
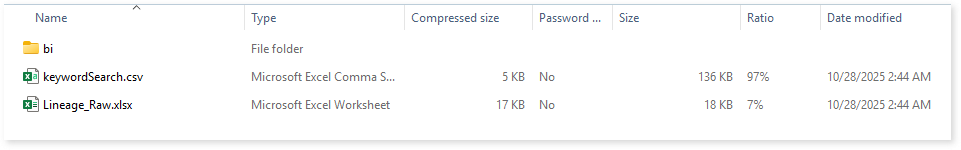
It is an intermediate report which helps to debug failures or calculate the final report. It includes all the generated CSV reports. This folder contains a bi folder along with the keywordSearch.csv and Lineage_Raw.xlsx reports.
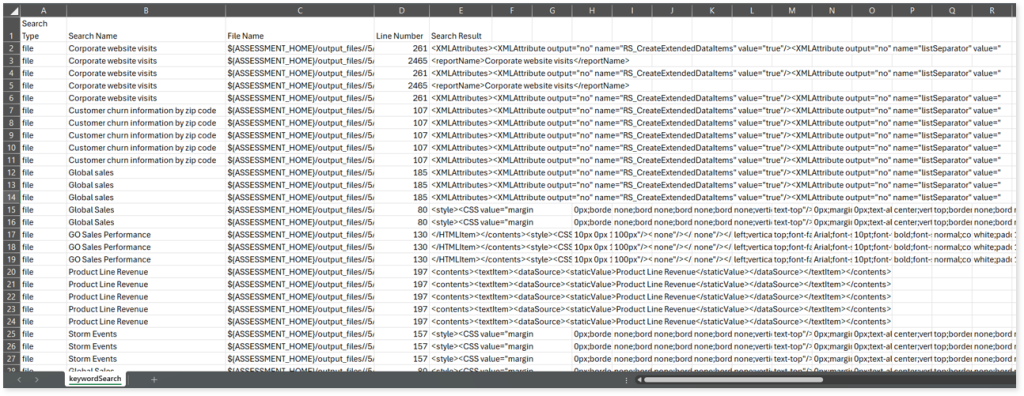
keywordSearch.csv: This report provides information about all the identified files using the file keyword search across uploaded source files. It includes details such as the search type, the file that contains the search keyword, the line number where it occurs, and other related information for each keyword.
This report helps to identify where specific file names appear across the uploaded source files. The system searches for each file name across all other uploaded source files, excluding the same file.
For example, if there are three files—File 1, File 2, and File 3—the system searches for occurrences of File 1 only in File 2 and File 3, excluding File 1 itself.
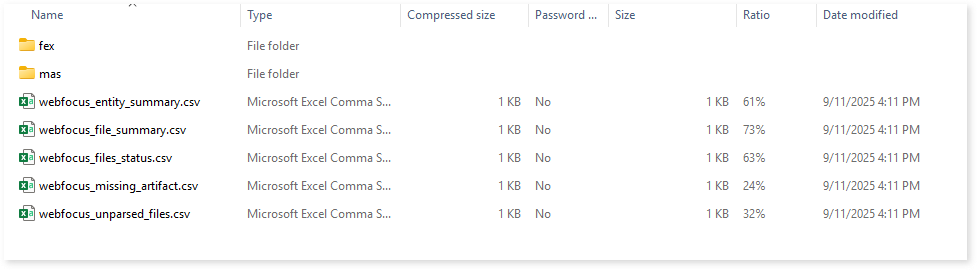
Browse through bi > webfocus folders to access all the generated CSV reports such as webfocus_entity_summary.csv, webfocus_file_summary.csv, webfocus_files_status.csv, webfocus_missing_artifact.csv, webfocus_unparsed_files.csv, and more.
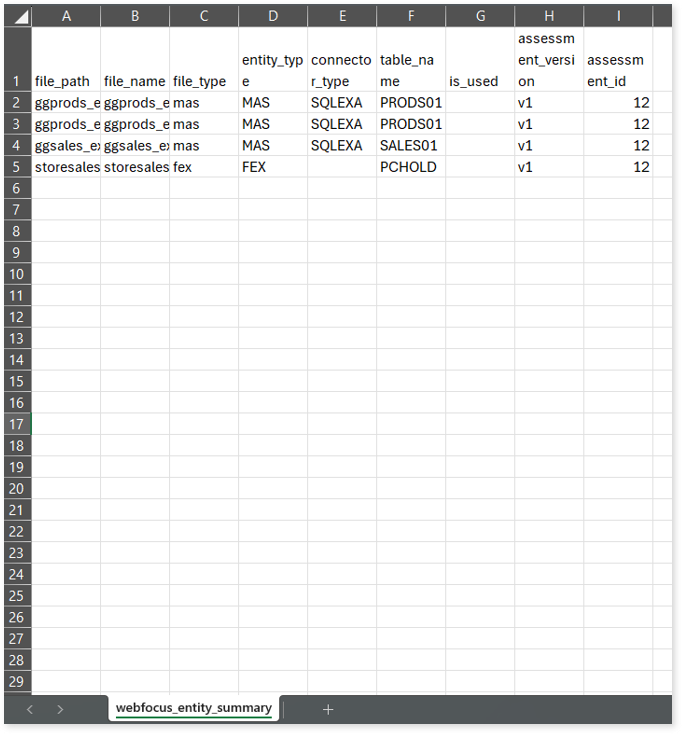
webfocus_entity_summary.csv: This report provides information about entities including their type, connection type, associated table, and more.
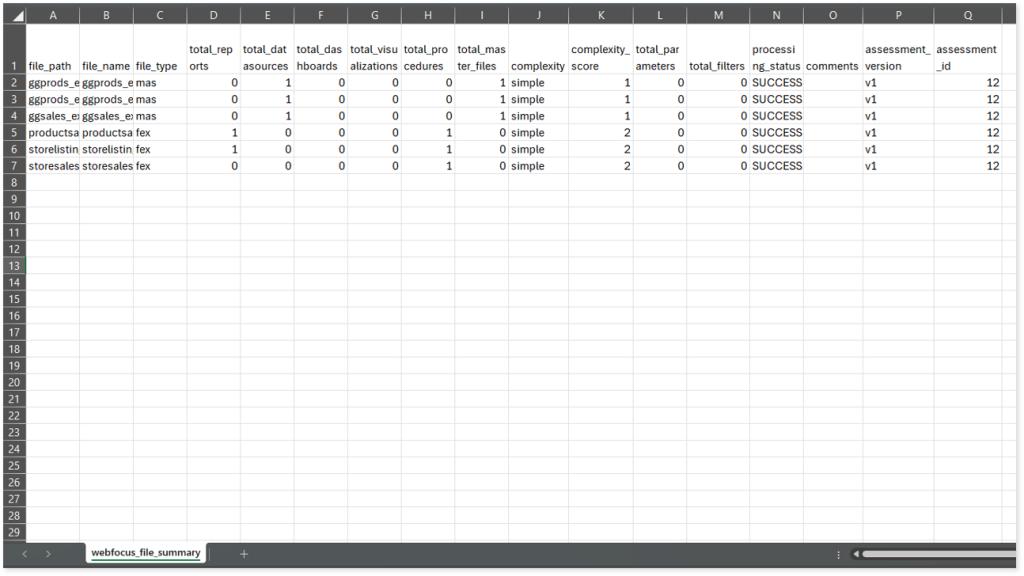
webfocus_file_summary.csv: This report lists all the files along with their type, total number of reports, dashboards, data sources, complexity, and more.
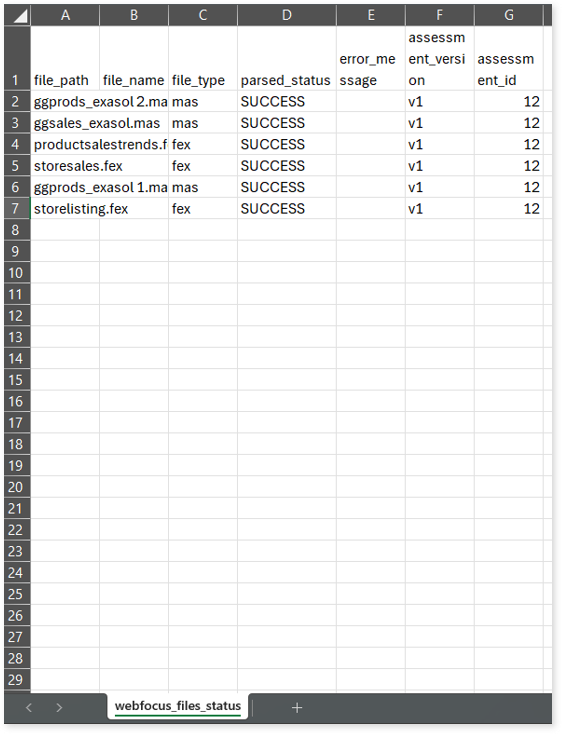
webfocus_files_status.csv: This report provides parsing status of each file along with its type.
webfocus_missing_artifact.csv: This report provides information about missing artifacts.
webfocus_unparsed_files.csv: This report lists all the unparsed files along with their type and the reason for parsing failure.