Informatica Assessment Report
This topic contains information about the Informatica assessment report. The assessment assesses workloads and produces in-depth insights that help to plan the migration. The input format for Informatica assessment is XML, or PRM file format.
In This Topic:
Highlights
The highlights section gives you a high-level overview of your assessment summary of the analytics performed on the selected workloads. It includes a graphical depiction of the complexity of files as well as the summary of the files used.
Summary
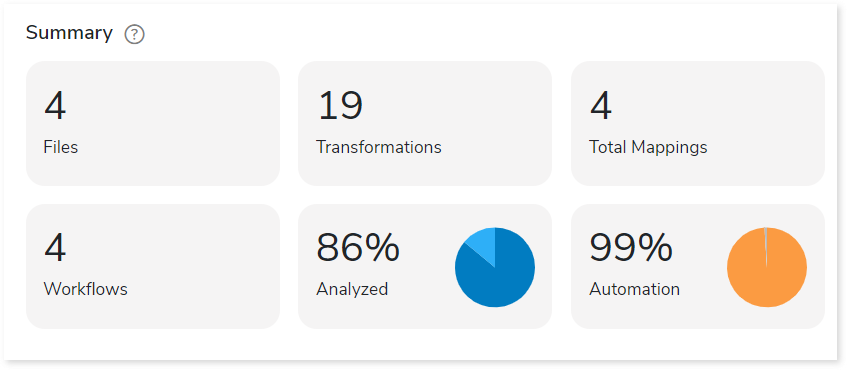
This section illustrates the input informatica graphs that were analyzed throughout the various workflows and components. Here, you can see the number of files, transformations, mappings, workflows, analyzed percentage as well as auto-conversion percentage of the workloads.
Scheduler
Schedulers monitor and execute tasks or jobs at a specific time.
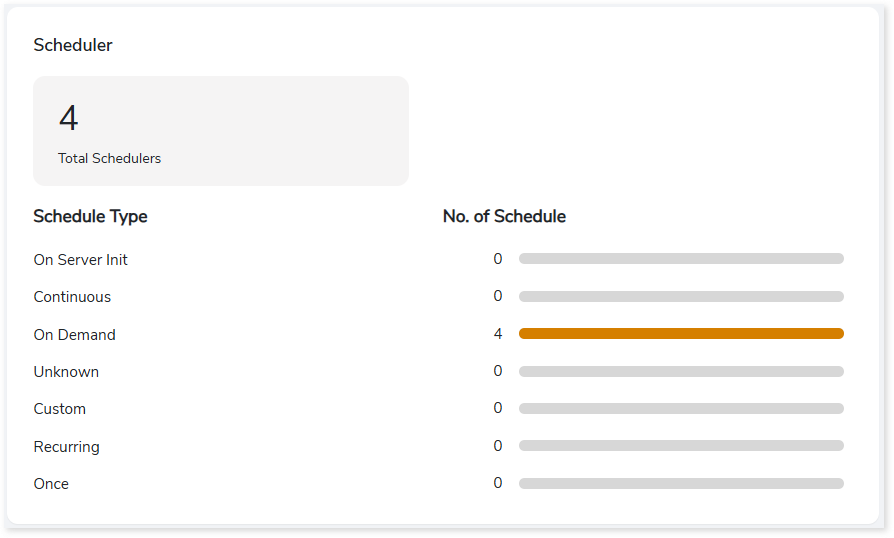
- On Server Init: The jobs are triggered based on the availability of the server.
- Continuous: Jobs that are continuously executed based on a scheduled time.
- On Demand: Jobs that are triggered manually for execution.
- Unknown: Jobs that do not belong to the above categories.
- Custom: Jobs that run based on custom defined schedule pattern.
- Recurring: Jobs that are triggered repeatedly at fixed intervals.
- Once: Jobs that are scheduled to run only a single time at a specified time.
Complexity
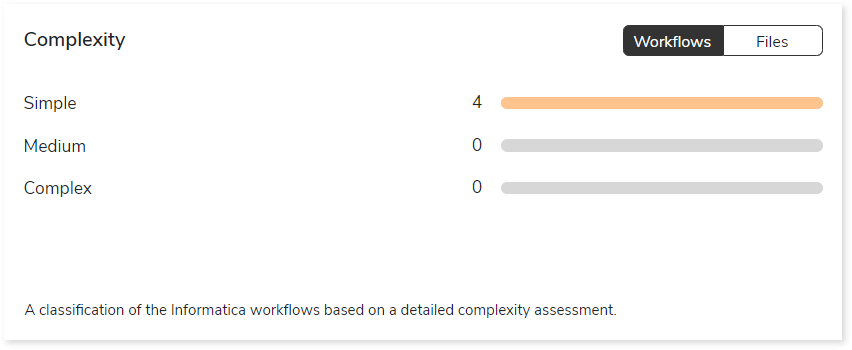
This section provides a summarized graphical representation of the classification of Informatica files and workflows based on a detailed complexity assessment. This information is required to make different decisions, including migration planning, estimating budget etc.
Analysis
This topic provides a detailed examination of source files, entities, and artifacts.
Source Analysis
This section provides a comprehensive report of the source files with information about the total number of files, source databases, workflows, complexity, external files, and so on.
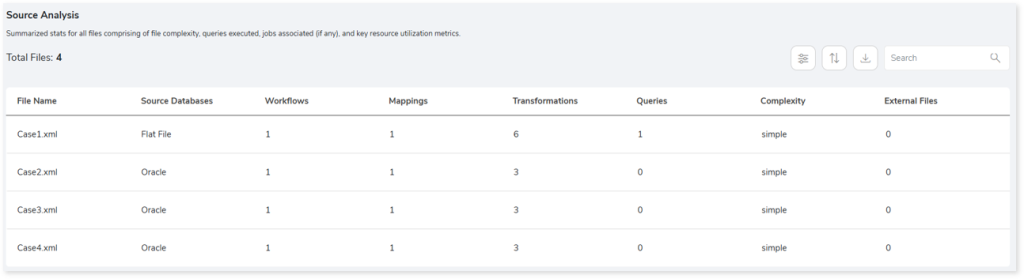
- File Name: Displays name of the file.
- Source Databases: Provides details about the source database.
- Workflows: Displays the number of workflows. It is a set of instructions to perform various actions.
- Mappings: Displays the number of mappings. It describes the flow of data between source and target.
- Transformations: Displays the number of transformations. It is a set of instructions to create, modify, or transform data to the target.
- Queries: Provides the total number of queries in the file.
- Complexity: Displays the complexity of the files.
- External Files: Displays the number of external files.
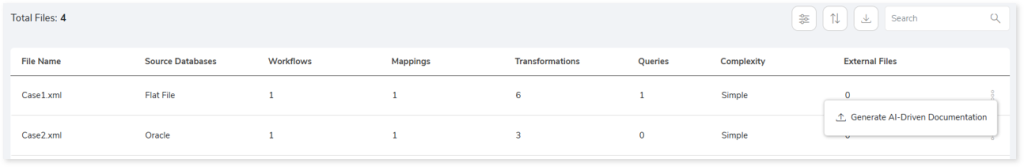
AI-Powered Source Code Documentation
To generate AI- Powered Source Code documentation, follow the steps below:
- Click More Actions (
 ) in the required file row.

- Click Generate AI-Driven Documentation.
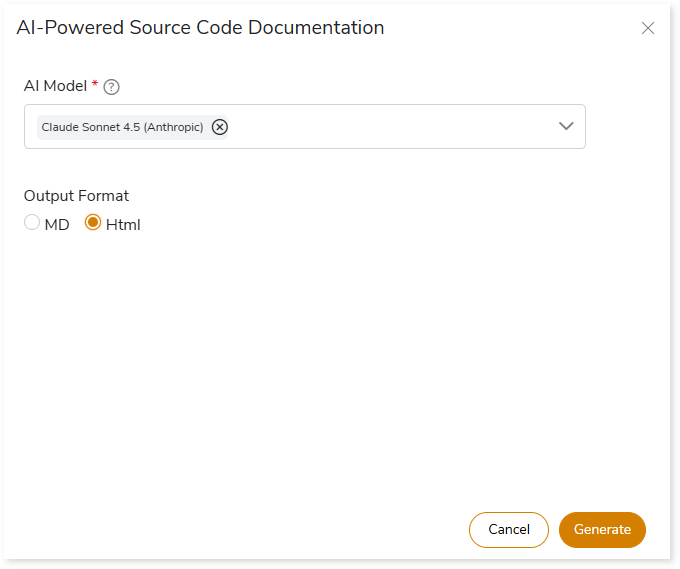
- The AI‑Powered Source Code Documentation window opens. In AI Model, select an AI model—such as Amazon Bedrock Claude, Nova, and more.
- In Output Format, select the desired output format to automatically generate comprehensive source-code documentation in Markdown (MD) or HTML.
- Click Generate.
To view the generated AI-Powered Source Code documentation, follow the steps below:
- Click More Actions () in the same file row.
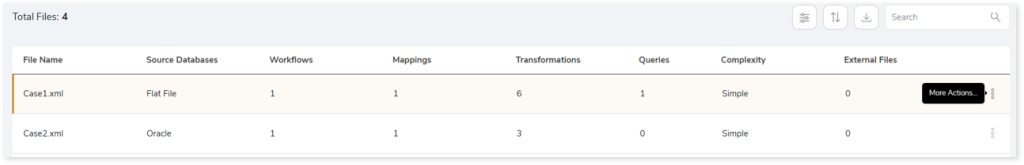
- Click Download to get the generated report.
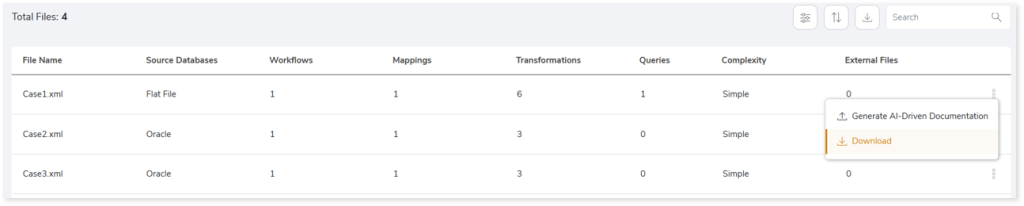
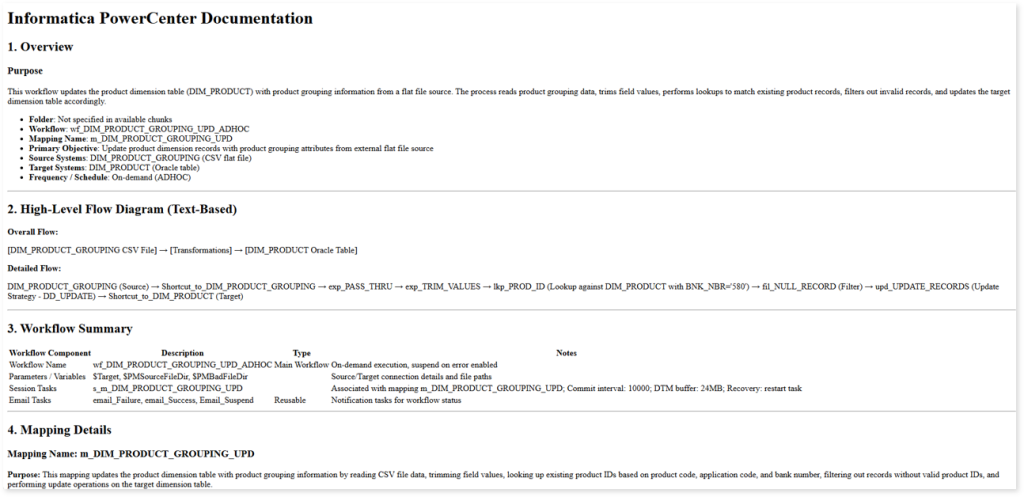
- After downloading, click the downloaded document to open and view the source code documentation. This report summarizes workflow and mapping details, including overview, high-level flow diagram, workflow summary, mapping details, and more.
Entities
This section displays a detailed analysis of the entities comprising the available and missing tables.
Tables
This section provides details about the tables used in the Lookup transformation, source, and target. The Lookup transformation is used to calculate field values from the source, source qualifier, or target to retrieve required data.
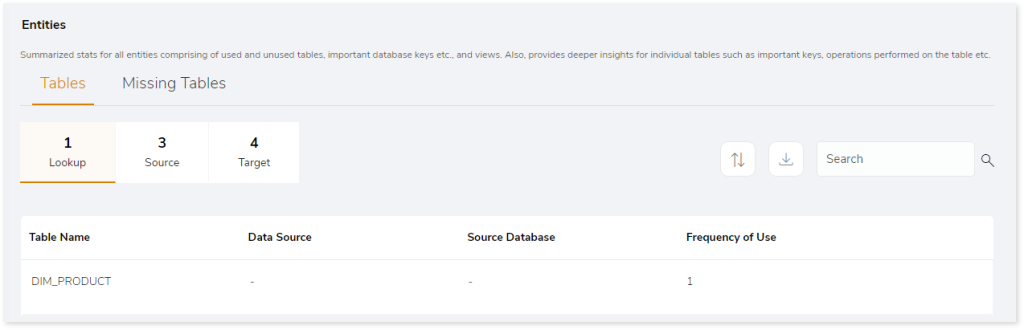
- Table Name: Displays name of the table.
- Data Source: Provides details of data source.
- Source Database: Provides the details of the source database.
- Frequency of Use: Provides the frequency of table usage.
Missing Tables
This section provides a list of all the missing tables.
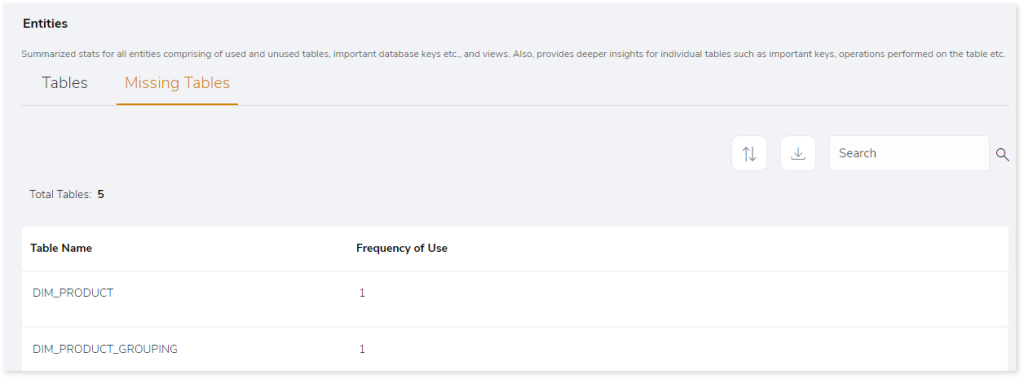
- Table Name: Displays name of the table.
- Frequency of Use: Provides the frequency of table usage.
Scheduler
This section provides information about the jobs including the types, status, start time, and more.
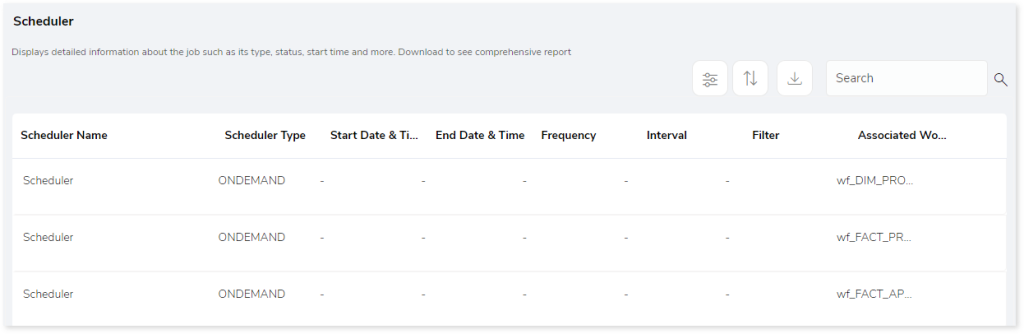
- Scheduler Name: Displays the name of the scheduler.
- Scheduler Type: Displays the type of the scheduler such as ONDEMAND, Continuous, etc.
- Start Date & Time: Displays the job execution start date and time.
- End Date & Time: Displays the job execution end date and time.
- Frequency: Displays the frequency of the scheduled jobs such as daily, weekly, monthly, etc.
- Interval: Displays the frequency interval of the scheduled jobs.
- Filters: To filter the data based on specific requirements. For example: Run the job only for specific geography.
- Associated Workflow: Displays information about the associated workflow.
Workflows
This section provides a summary of workflows with information about mappings, complexity, and associated files.
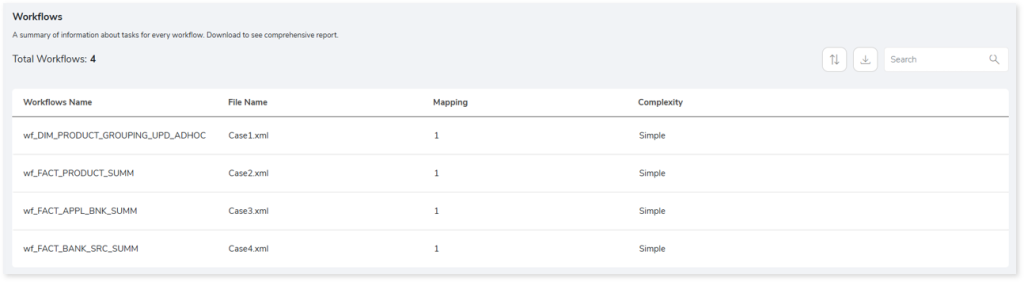
- Workflows Name: Displays name of the workflow.
- File Name: Displays the associated source file.
- Mapping: Describes the flow of data between source and target.
- Complexity: Displays the complexity of the workflows.
Artifacts
This page gives details about artifacts-collections of the related server data. It provides a list of missing artifacts, artifacts that appear additionally, or could not be parsed completely due to some error.
Missing Artifacts
This section provides the details of all the missing artifacts. Additionally, it categorizes the missing artifacts into files and entities that are missing.
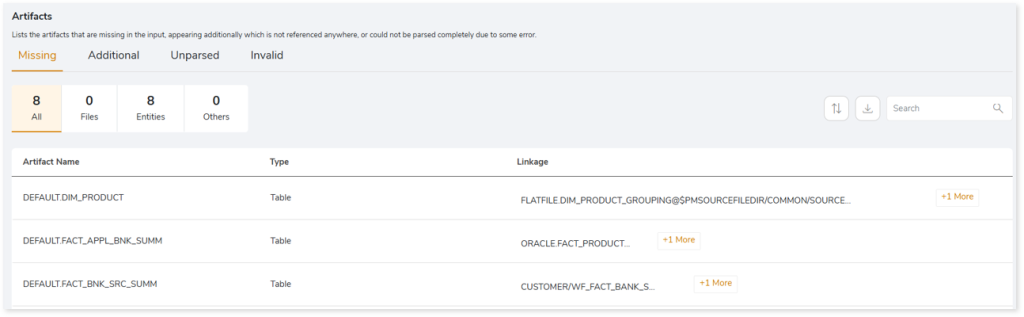
- Artifact Name: Displays name of the artifact.
- Type: Provides the type of the artifacts such as file, table, etc.
- Linkage: Provides the linked or associated file names.
Additional Artifacts
This section provides the details of all the artifacts that appear additionally. It also categorizes the additional artifacts into files and entities.
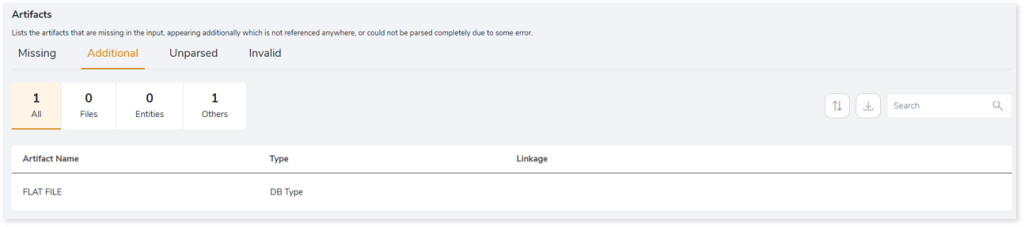
- Artifact Name: Displays name of the artifact.
- Type: Provides the type of the artifacts such as file, table, etc.
- Linkage: Provides the linked or associated file names.
Unparsed Artifacts
This section provides the details of all the artifacts that could not be parsed completely due to some error.
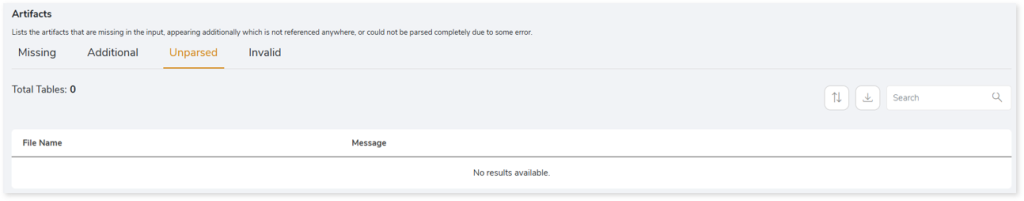
- File Name: Displays the name of the unparsed artifact.
- Message: Displays the reason why the artifact is marked as unparsed.
Invalid
This section lists all the invalid artifacts.
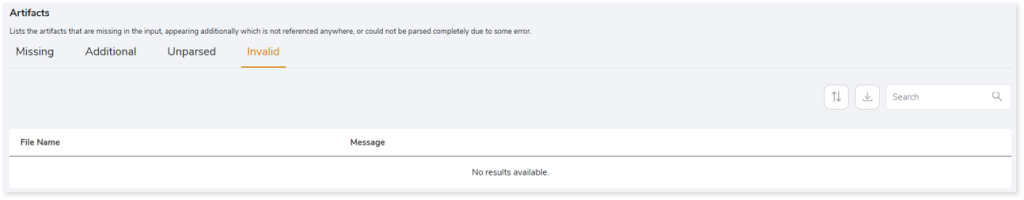
- File Name: Displays the name of the invalid artifact.
- Message: Displays the reason why the artifact is marked as invalid.
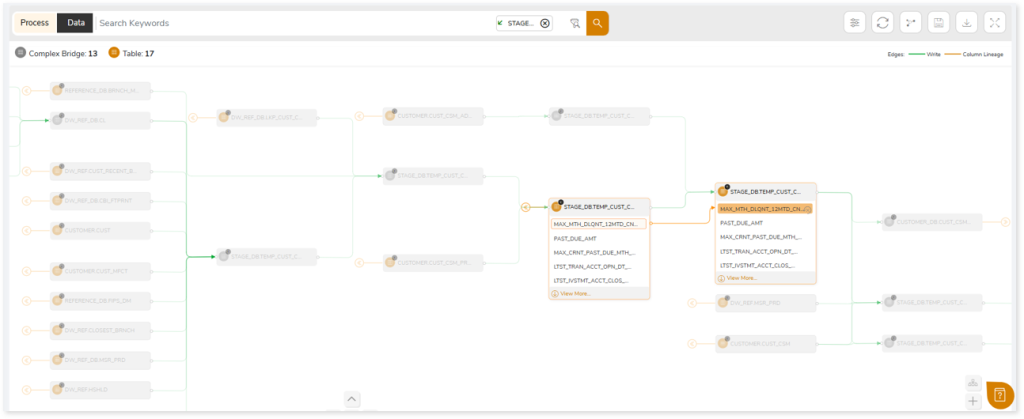
Lineage
End-to-end data and process lineage identify the complete dependency structure through interactive and drill-down options to the last level.
Typically, even within one line of business, multiple data sources, entry points, ETL tools, and orchestration mechanisms exist. Decoding this complex data web and translating it into a simple visual flow can be extremely challenging during large-scale modernization programs. The visual lineage graph adds tremendous value and helps define the roadmap to the modern data architecture. It deep dives into all the existing flows, like Autosys jobs, applications, ETL scripts, BTEQ/Shell (KSH) scripts, procedures, input and output tables, and provides integrated insights. These insights help data teams make strategic decisions with greater accuracy and completeness. Enterprises can proactively leverage integrated analysis to mitigate the risks associated with migration and avoid business disruption.
Now, let’s see how you can efficiently manage lineage.
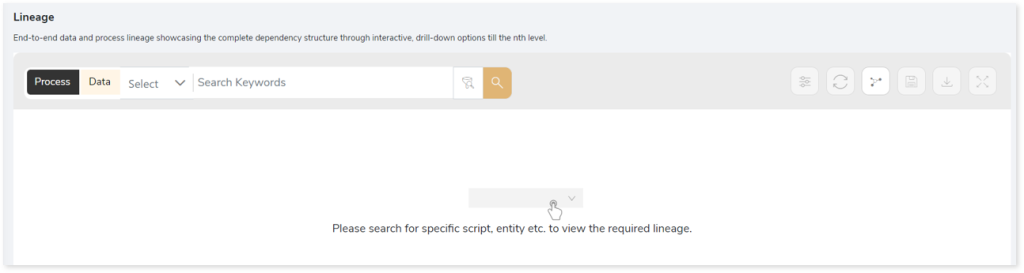
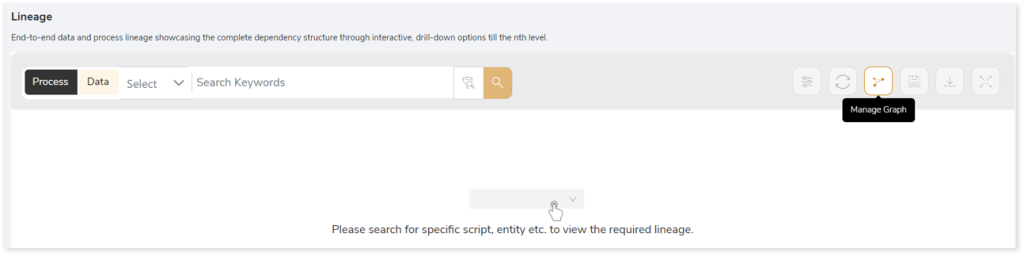
To view the required lineage:
- Select either the Process or Data tab to enable process or data lineage respectively.
- Enter the keywords in the Search Keywords field you want to search. Else, simply select the entities, flat files, jobs, workflows, etc., from the Search dropdown.
- To generate column-level lineage, turn on Include Columns toggle (available only in Data Lineage).
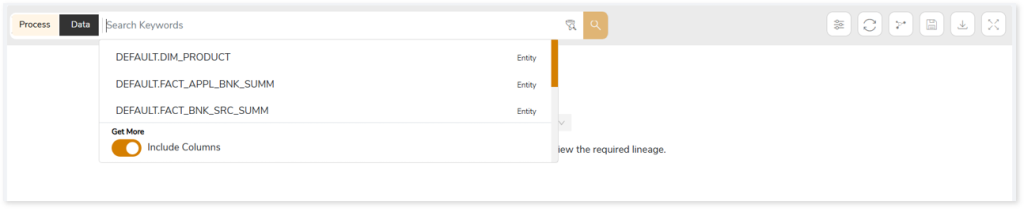
- Click the Search icon to generate the lineage.
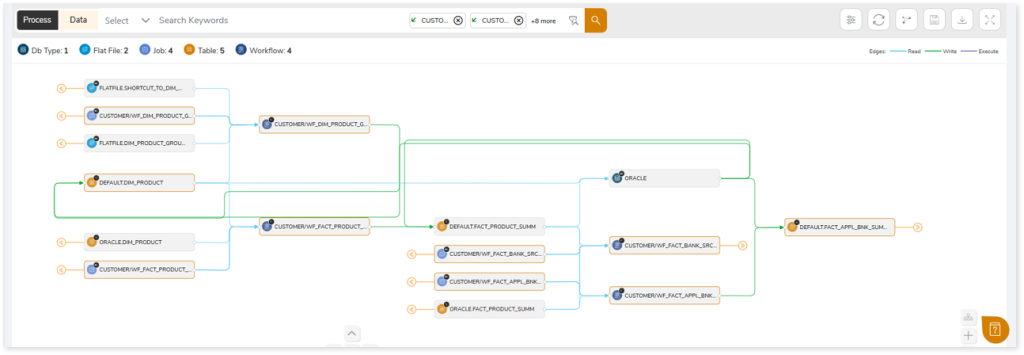
Lineage helps you understand dependencies across processes, tables, and columns:
- Process lineage illustrates the dependencies between two or more processes such as files, orchestration dependencies, workflows, etc.
- Data lineage depicts the table-level dependencies and column-level dependencies–input tables, output tables, and reference tables.
- Column-Level lineage shows granular transformations and updates at the minutest level.

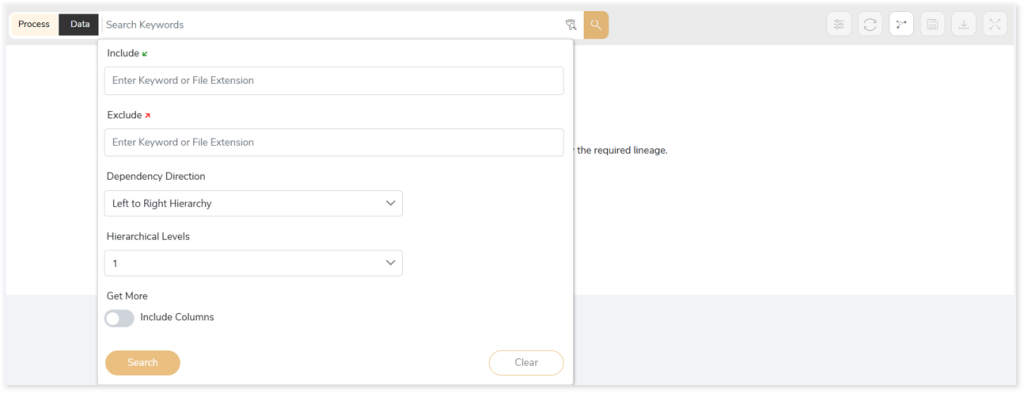
In addition, the filter search icon allows you to include or exclude particular nodes to obtain the required dependency structure. It helps you quickly narrow down complex dependency graphs to focus on the exact nodes, relationships, or data flows you want to analyze. Instead of navigating through an entire lineage network, you can apply filters based on object names, types, or relationship categories—making it easier to isolate specific tables, workflows, or transformation paths. This feature enhances traceability, reduces visual clutter, and enables you to precisely identify upstream or downstream dependencies that are most relevant to your analysis or migration scope.
You can also choose the direction of the lineage. By default, the Dependency Direction is Left to Right Hierarchy. This insight is useful to identify and analyze upstream data connections and relationships. You can also choose Right to Left Hierarchy – most useful for how data is getting consumed through the downstream route and which are the participating tables and columns, or Bidirectional dependency direction to visualize both kinds in a single view.
Moreover, you can also increase the Hierarchy Levels to nth level. This again allows great freedom to visualize the end-to-end hierarchy in one go.
Lineage facilitates you visualize how your selected nodes are connected and depend on each other. The nodes and their connecting edges (relationships) help you to understand the overall structure and dependencies.
|
Nodes |
Edges |
 Tables Tables |
 Call Call |
 File File |
 Read Read |
 Job Job |
 Execute Execute |
 Autosys Box Autosys Box |
 Write Write |
 Workflows Workflows |
 Others Others |
 Flat File Flat File |
|
 DB Type DB Type |
|
Manage Lineage
This feature enables you to view and manage your lineage. You can add, modify, or delete nodes and their relationships to generate an accurate representation of the required dependency structure. There are two ways to update the lineage: either using Complete Lineage report or Lineage Template.
Using Complete Lineage report
Follow the below steps to modify the lineage:
- Click the Manage Graph icon.
- Click Download Complete Lineage to update, add, or delete the nodes and their relationships in the current lineage.
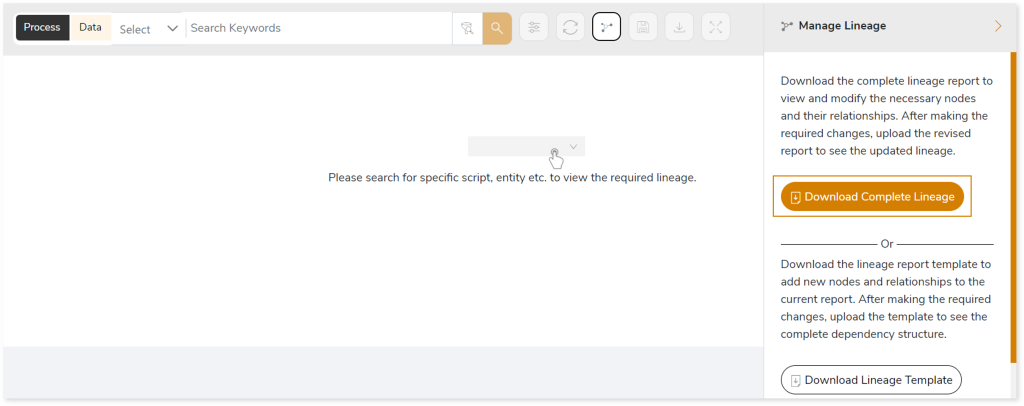
- Once the complete lineage report is downloaded, you can make necessary updates such as updating, deleting or adding the nodes and its relationships.
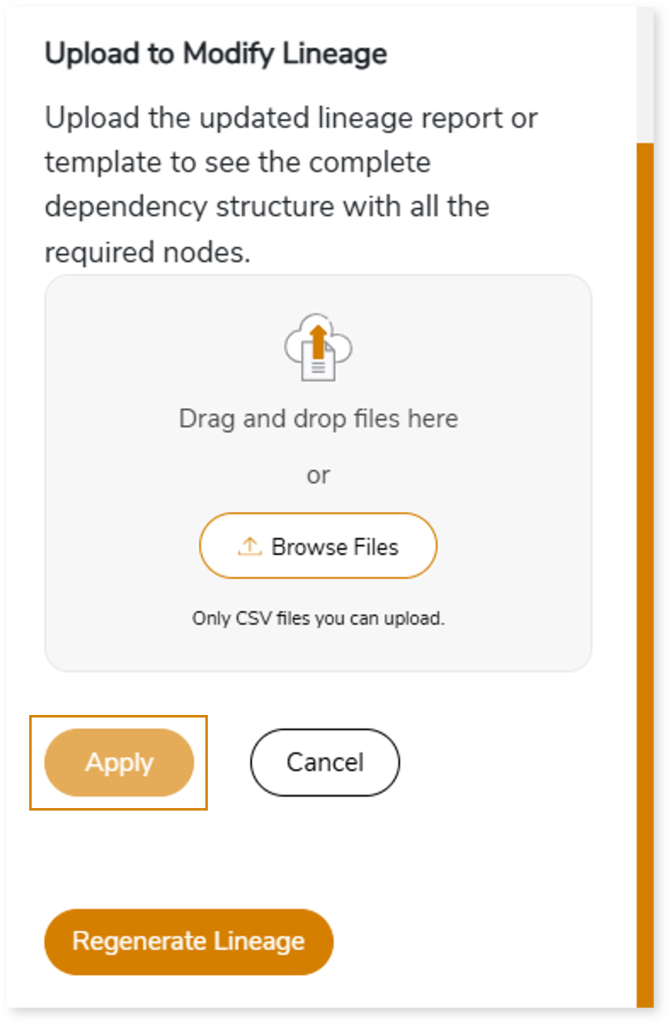
- After making the required changes, upload the updated lineage report in Upload to Modify Lineage.
- Click Apply to incorporate the changes into the dependency structure.
- Generate the required process or data lineage.
- Click Regenerate Lineage to update the Lineage Analysis report with the latest data.

Using Lineage Template
Follow the below steps to add new nodes and their relationships to the current lineage report:
- Click the Manage Graph icon.

- Click Download Lineage Template.
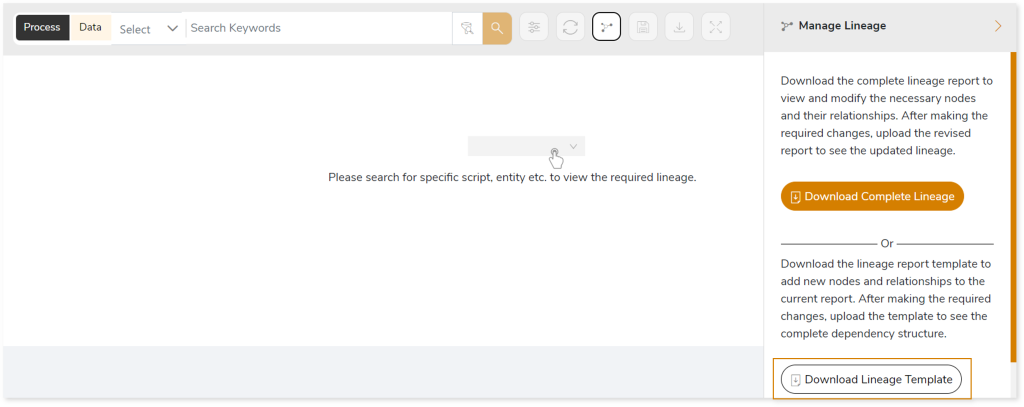
- Once the lineage template is downloaded, you can add new nodes and relationships in the template.
- After making the required changes, upload the template in Upload to Modify Lineage.
- Click Apply to incorporate the updates into the complete dependency structure.
- Generate the required process or data lineage.
- Click Regenerate Lineage to update the Lineage Analysis report with the latest data.
You can also apply:
| Feature | Icon | Use |
| Filter |  | Used to filter the lineage. |
| Reload Graph |  | Assists in reloading graphs. |
| Manage Graph |  | To view and manage lineage by adding, modifying, or deleting nodes and their relationships to accurately reflect dependency structures. |
| Save |  | Used to save the lineage. |
| Download |  | Used to download the file. |
| Expand |  | Used to enlarge the screen. |
Downloadable Reports
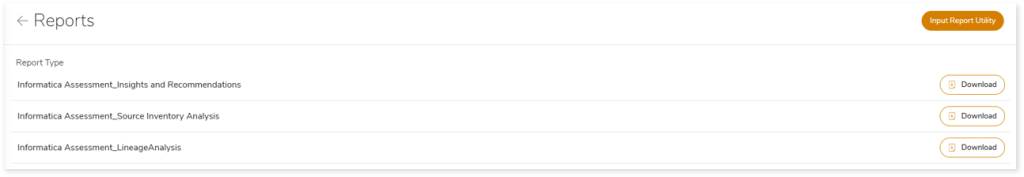
Downloadable reports allow you to export detailed assessment reports of your source data which enables you to gain in-depth insights with ease. To access these assessment reports, click Reports.

Types of Reports
In the Reports section, you can see various types of reports such as Insights and Recommendations, Source Inventory Analysis, and Lineage Analysis reports. Each report type offers detailed information allowing you to explore your assessment results.
Insights and Recommendations
This report provides an in-depth insight into the source input files. It contains the final output including the details of queries, complexity, workflows, mappings, and so on.
Here, you can see the informatica folder along with Informatica Assessment.xlsx report.
Informatica Assessment.xlsx: This report provides insights about the source inventory. It helps you plan the next frontier of a modern data platform methodically. It includes a report summary, aggregated inventory, transformations, workflows, mappings, and more.
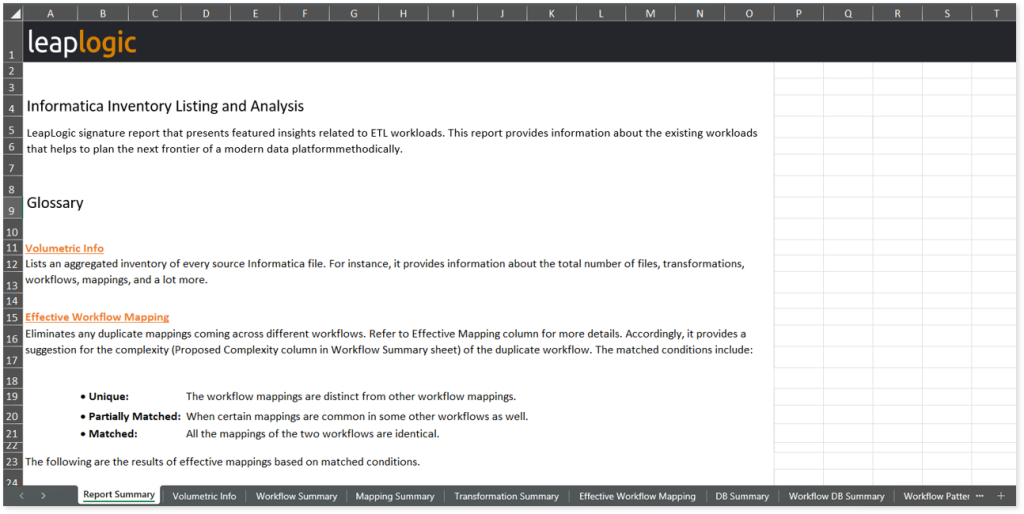
This report contains the following information:
- Report Summary: Provides information about all the generated artifacts.
- Volumetric Info: Lists an aggregated inventory of every source Informatica file. For instance, it provides information about the total number of files, transformations, workflows, mappings, and a lot more.
- Workflow Summary: Lists all the workflows existing in the Informatica files. It also provides statistical information about the worklets, sessions, mappings, mapplets, expressions, transformation components such as sequences, filters, joiners, and so on.
- Mapping Summary: Describes the flow of data between source and target. It lists all the mappings and the count of associated transformations such as expression input columns, expression output columns, aggregators, filters, joiners, and so on.
- Transformation Summary: Lists all the input source files along with the count of workflows, worklets, sessions, mappings, mapplets, and so forth available in the source files.
- Effective Workflow Mapping: Eliminates any duplicate mappings coming across different workflows. Refer to Effective Mapping column for more details. Accordingly, it provides a suggestion for the complexity (Proposed Complexity column in Workflow Summary sheet) of the duplicate workflow. The matched conditions include:
- Unique: The workflow mappings are distinct from other workflow mappings.
- Partially Matched: When certain mappings are common in some other workflows as well.
- Matched: All the mappings of the two workflows are identical.
The following are the results of effective mappings based on matched conditions.
|
Is Matched Condition |
Effective Mapping of 1st workflow |
Effective Mapping of 2nd workflow |
|
Matched |
Displays all workflow mappings |
None |
|
Partially Matched |
Displays all workflow mappings |
Displays the remaining workflow mappings which are not present in the 1st workflow |
|
Unique |
Displays all workflow mappings |
Displays all workflow mappings |
- DB Summary: Provides information about the files available in the databases. It displays the count of workflows, mappings, source files, target files, and so on.
- Workflow DB Summary: Provides workflow-level details. It includes the count of mappings, source files, target files, and so on.
- Workflow Patterns: Provides details about workflows with similar patterns along with the number of occurrences.
- Worklet Patterns: Provides details about worklets with similar patterns along with the number of occurrences.
- Mapping Patterns: Provides details about mappings with similar patterns along with the number of occurrences.
- Mapplet Patterns: Provides details about mapplets with similar patterns along with the number of occurrences.
- Transformation Patterns: Provides details about transformations with similar patterns. It also includes information about transformation types, patterns, and occurrences.
To access other assessment reports, open the informatica folder. Here, you can see CSV, pattern, and query folders along with assessment_column_lineage.csv, informatica_data lineage, and param_file.csv reports.
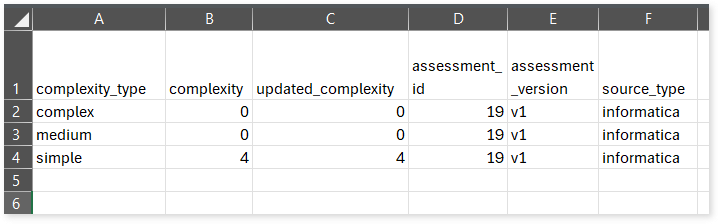
Navigate to the csv folder to access the Updated Complexity.csv file.
Updated Complexity.csv: This report provides information about the updated complexity of Informatica scripts. During the configuration of the Informatica Assessment, you can redefine the Complexity Distribution field to transfer the complexity of ETL scripts from a higher level to a lower level. This updated complexity is reflected in this report.
Browse through the pattern folder to get information about similar patterns including transformations, mappings, mapplets, workflows, and worklets.
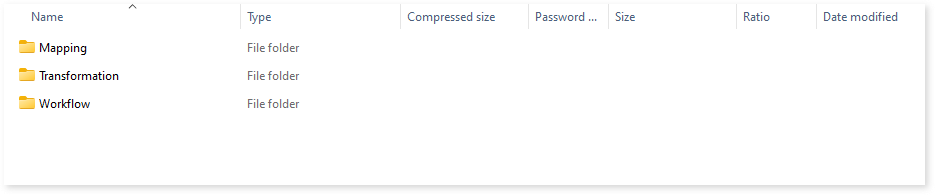
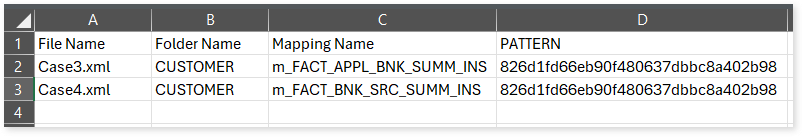
Mapping: In this folder you can see the CSV file which contains details about mappings with similar patterns.
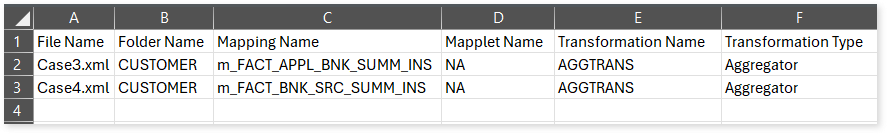
Transformation: In the Transformation folder, you can see CSV files for various transformation types such as aggregators, sorters, and source qualifiers.
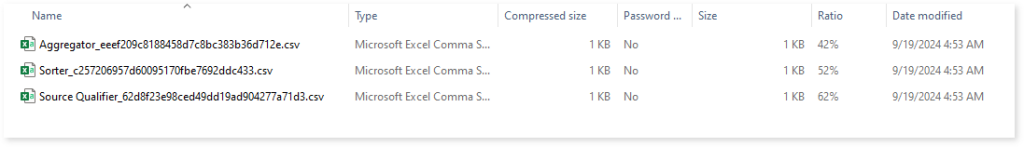
Each CSV file provides information about similar patterns within its respective transformation type.
Workflow: In this folder you can see the CSV file which contains details about workflows with similar patterns.
Browse through the query folder to access Query.csv, and Statement Type Summary.csv reports.
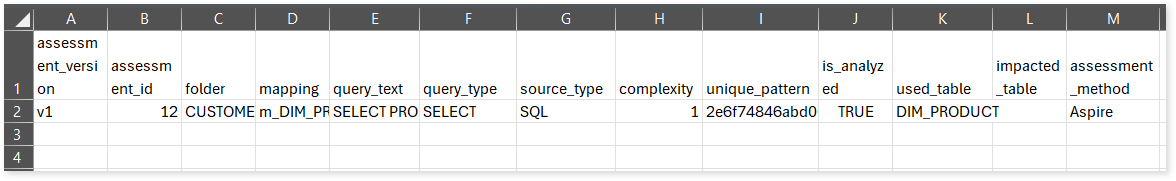
Query.csv: This report provides information about queries including their type, complexity, and more.
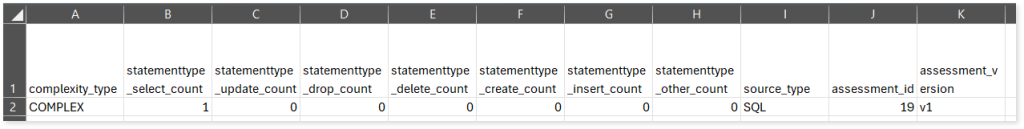
Statement Type Summary.csv: Provides information about queries segregated by statement types such as SELECT, UPDATE, INSERT, DELETE, etc.
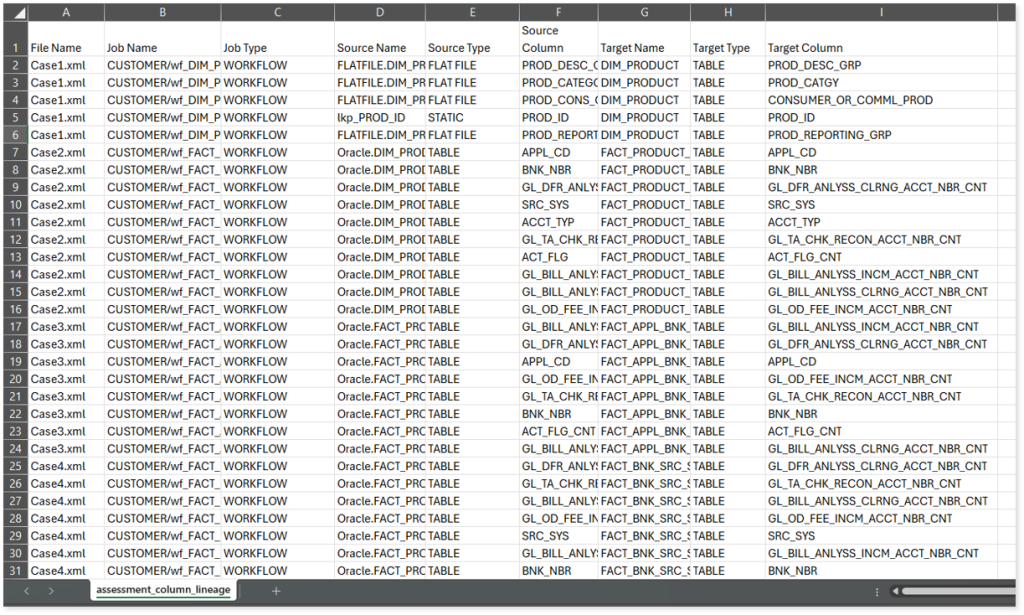
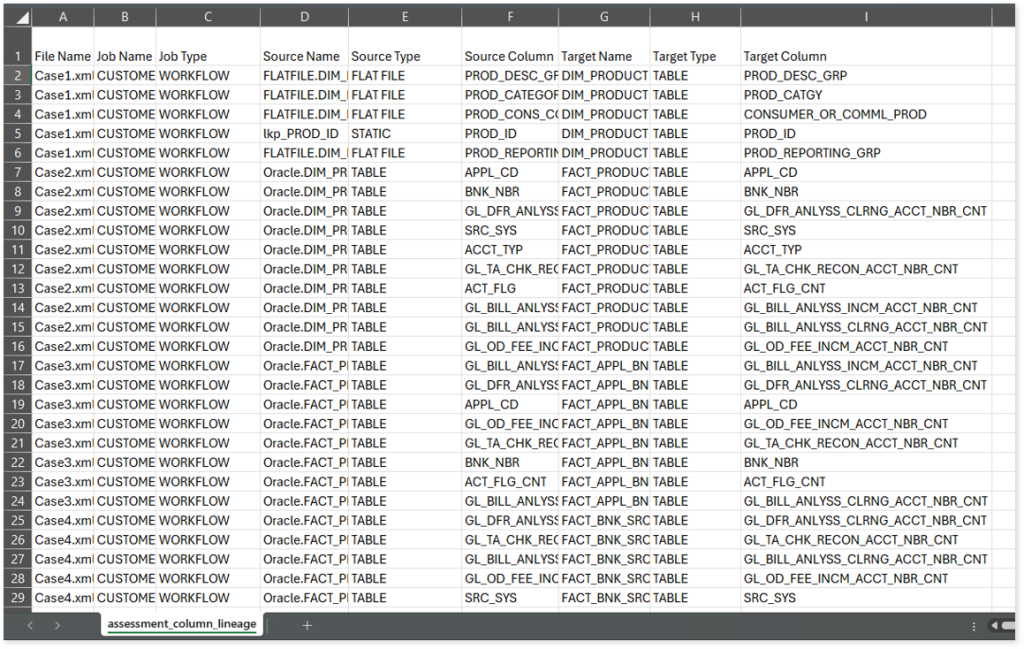
assessment_column_lineage.csv: This report provides information about workflow-level column lineage. It includes information about source and target nodes (tables or files) along with associated columns, types, and more.
informatica_dataLineage.csv: This report provides information about entity or file level lineage based on write operation.
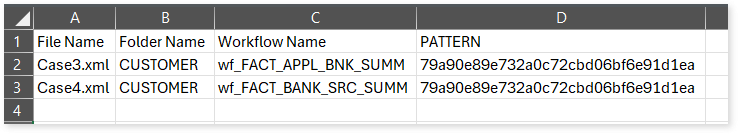
param_file.csv: Provides details about parameter files, including their file path, workflow, and more.
Source Inventory Analysis
It is an intermediate report which helps to debug failures or calculate the final report. It includes all the generated csv reports.
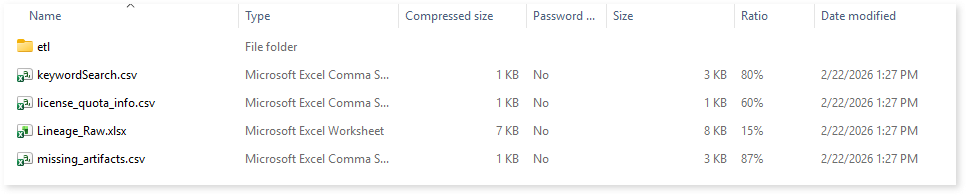
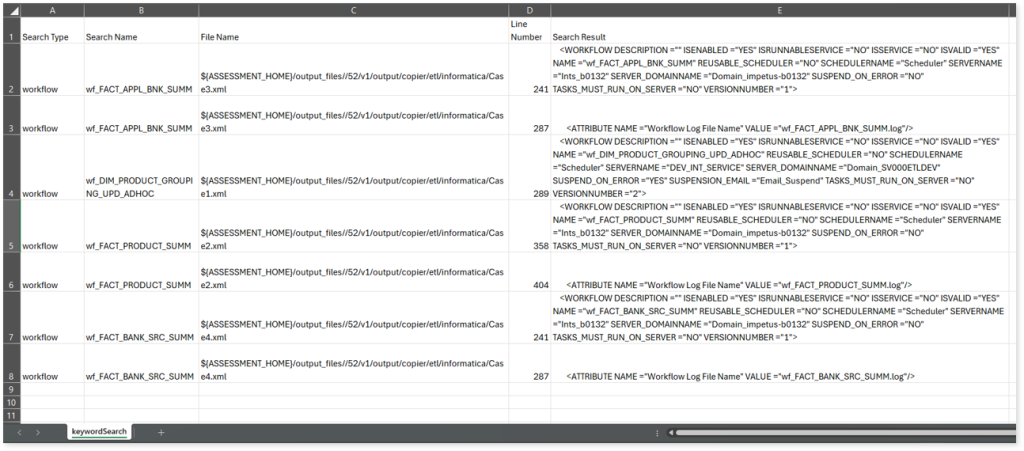
keywordSearch.csv: Provides detailed insights into keyword occurrences— specifically workflows and procedures—identified across all uploaded source files. It captures information such as the search type, the file where the keyword was found, the line number of occurrence, and the actual line content where the keyword appears.
The system dynamically extracts a specific list of keywords (Workflows and Procedures) from the Workflow Summary.csv, informatica_external_procedure.csv, and internal_procedure.csv assessment output reports. These extracted keywords are then used to perform a case-insensitive search across all uploaded artifacts to help you to understand where specific workflows and procedures are referenced.
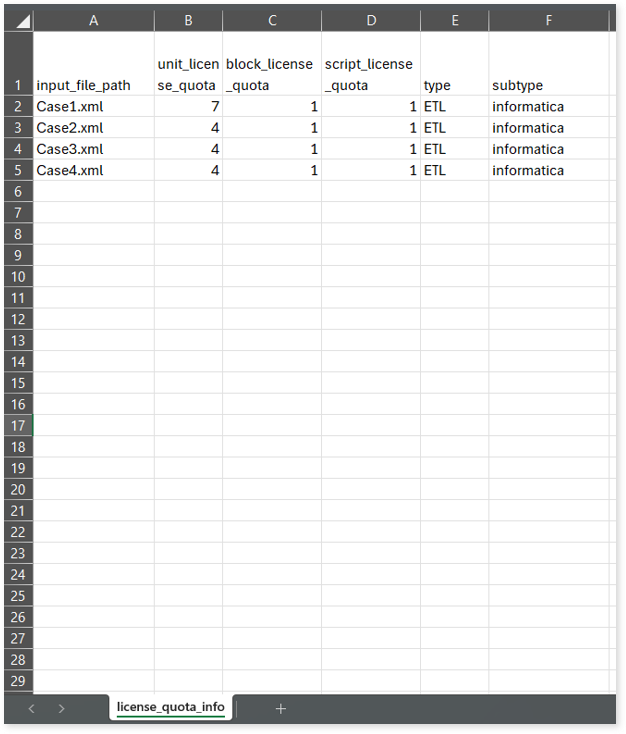
license_quota_info.csv: This report provides information about the anticipated license quota deduction when executing a transformation pipeline or notebook using the same source input file that was used during the assessment. It includes details about the expected quota consumption for units, blocks, and scripts.
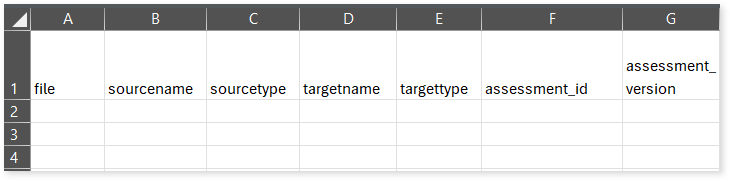
Lineage_Raw.xlsx: This report provides complete dependency details for all nodes. It provides an end-to-end data and process lineage that helps to identify the complete dependency structure and the data flow.
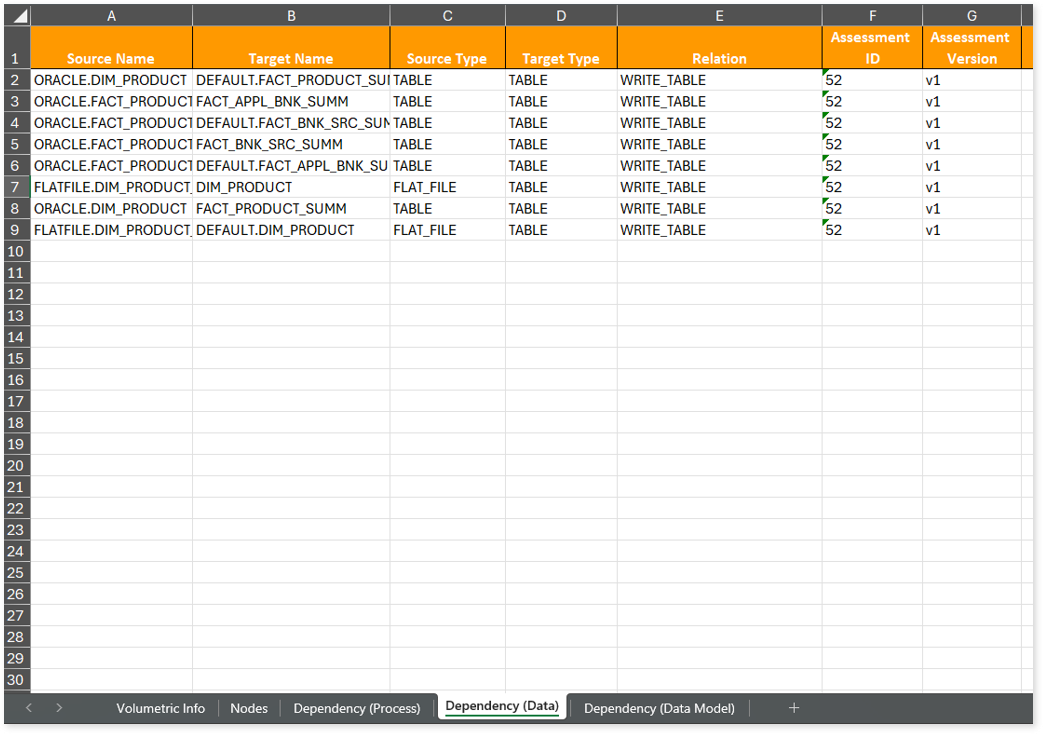
This report contains the following information:
- Volumetric Info: Provides volumetric information about the artifact types including tables, database types, workflows, flat files, informatica workflows, and scheduler jobs.
- Nodes: Lists all the source and target nodes along with their type. Each node represents a data object in the lineage—such as a table, file, job, etc.—making it easier to trace how data is consumed, transformed, and processed across the workflow.
- Dependency (Process): Provides information about the process lineage. It offers detailed visibility into interdependencies between processes—such as files, workflows, and orchestration steps—helping you understand how they are connected within the workflow.
- Dependency (Data): Provides information about the data lineage. It captures detailed table-level—including input tables, output tables, and reference tables—offering end-to-end visibility into how data flows and transforms across the workflow.
- Dependency (Data Model): Provides dependency details about the data models. It highlights the end-to-end relationships and dependencies between model elements, helping you understand structure and trace linkages.
missing artifacts: This report provides information about missing artifacts.

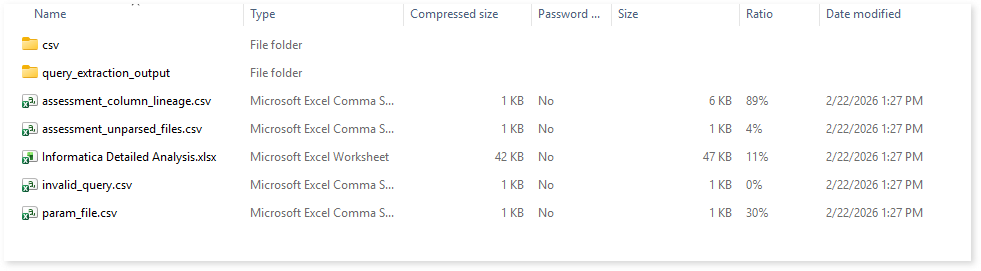
To access various outputs such as CSV reports, query extraction output, unparsed files, detailed analysis report, invalid queries, and more, navigate through the etl > informatica folders.
Browse through the csv folder to access reports such as Entity.csv, External Executable File.csv, Macro.csv, Scheduler.csv, Source.csv, Target.csv, and more.
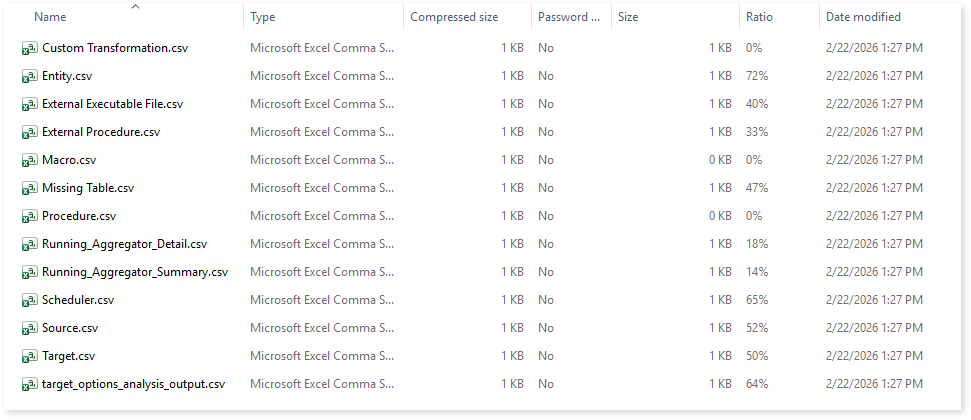
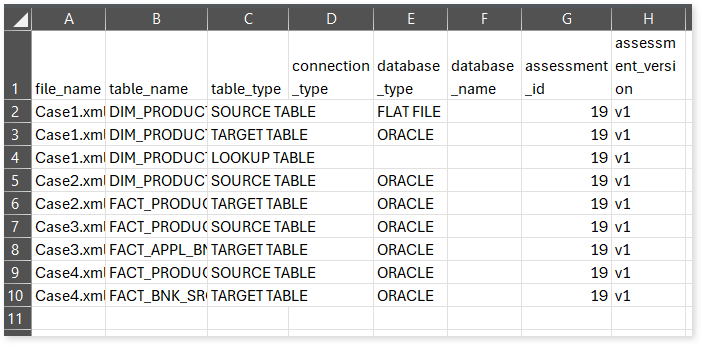
Entity.csv: This report provides information about entities. It includes information about table types, databases, connection types, and more.
External Executable File.csv: This report provides information about external executable files including workflows, executable file paths, commands, and more.
Macro.csv: This report provides information about macros in the source files.
Running_Aggregator_Detail.csv: Provides detailed information about Running Aggregator transformations identified in the uploaded source files, including where each transformation is derived from.
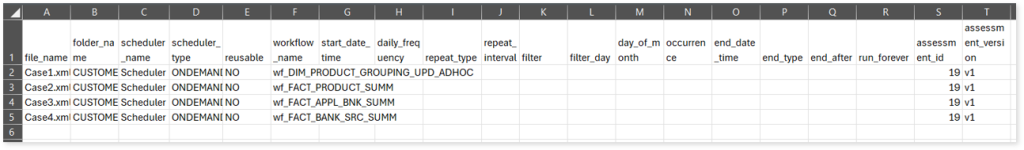
Scheduler.csv: This report provides information about schedulers, its type, reusability, and workflow associated with the scheduler. It also provides other scheduling-related information like start date, end date, repeat type, repeat interval, occurrence, filters, etc.
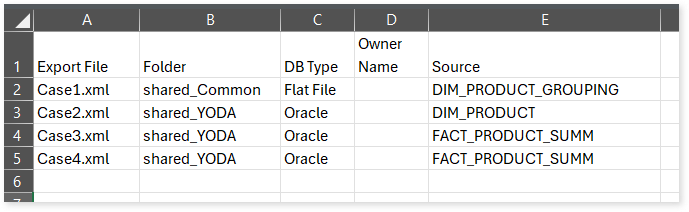
Source.csv: This report provides information about source database.
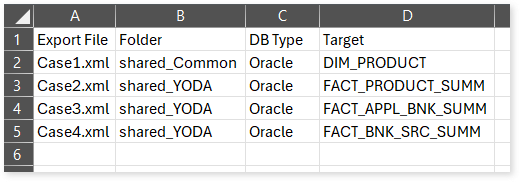
Target.csv: This report provides information about target database type and folder name.
assessment_column_lineage.csv: This report provides information about column‑level lineage, including how each source column connects to its target column, the associated job type, and other related details.
assessment_unparsed_files.csv: This report lists all the unparsed Informatica files along with the reason for parsing failure.
Informatica Detailed Analysis.xlsx: This report provides a detailed analysis report including workflows, mappings, connections, and more.
This report contains the following information:
- Report Summary: Provides information about all the generated artifacts.
- Workflows-L1: Set of instructions to perform various actions. It lists all the workflows along with information about the start and end nodes of the workflows, component type, mapping file, workflow command, and so on.
- Workflows-Override: Workflows can modify some elements within the transformation during execution. It lists all the overridden or altered workflows. It also provides information about the override component type, override component name, mapping files, and a lot more.
- Mappings: Describes the flow of data between source and target. Lists all the mapping files along with the component name, component type, and so on.
- Workflow Connections: Lists all workflows along with connection details. It also includes information about the session, mapping files, component type, connection variables, connection values, and so on.
- Worklets: Provides information about worklets including the associated workflows and their count.
- Connections: Interface to connect nodes. It lists mapping files, session, source connection subtype, connection variables, and so on.
invalid_query.csv: This report lists all the invalid queries.
param_file.csv: Provides details about parameter files, including their file path, workflow, and more.
Lineage Analysis
This section provides lineage-related reports, including entity_link.csv, entity_report.csv, entity_summary.csv, link.csv, script_report.csv reports.
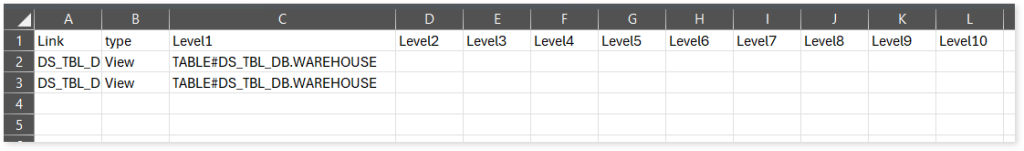
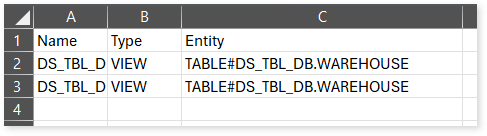
entity_links.csv: This report provides information about how views are connected to entities or tables and how these links extend across multiple levels. Level 1 shows the immediate table to which a view is linked. If that table is further connected to another entity, the next connection appears in Level 2, and so on.
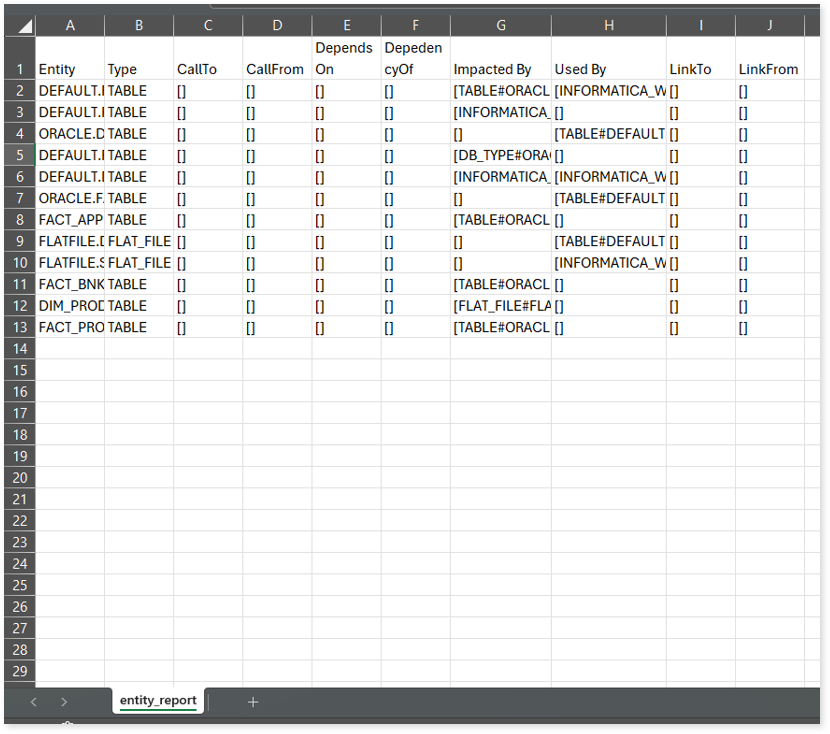
entity_report.csv: This report gives detailed lineage information for each entity in the uploaded source files. It lists all entities along with their types, dependencies, and relationships. The report also shows what each entity depends on, what impacts it, where it is used, and so on.
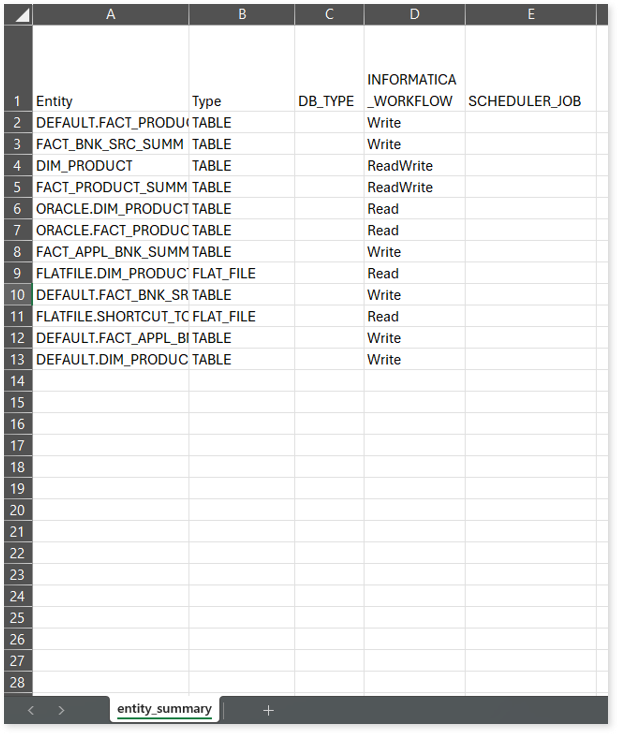
entity_summary.csv: This report provides a list of entities from uploaded source files, indicating where they appear (e.g., workflow, scheduler job, or database type) and the operations performed on them—Read, Write, or ReadWrite.
link.csv: This report provides information about entities linked to each view.
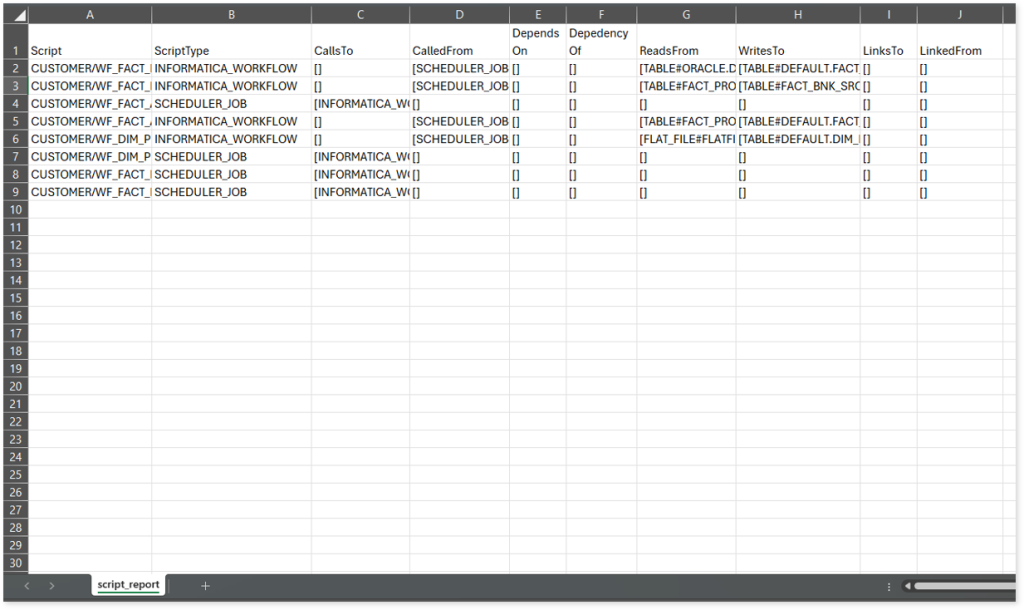
script_report.csv: This report provides detailed lineage information for each script. It lists all scripts along with their type, specifies the processes, entities, or scripts from which each script reads data and those to which it writes, as well as other dependency details.