Tableau to Amazon QuickSight Conversion Report
This topic provides a comprehensive report of Tableau to QuickSight conversion. The conversion pipeline converts Tableau datasets and dashboards to Amazon QuickSight equivalents.
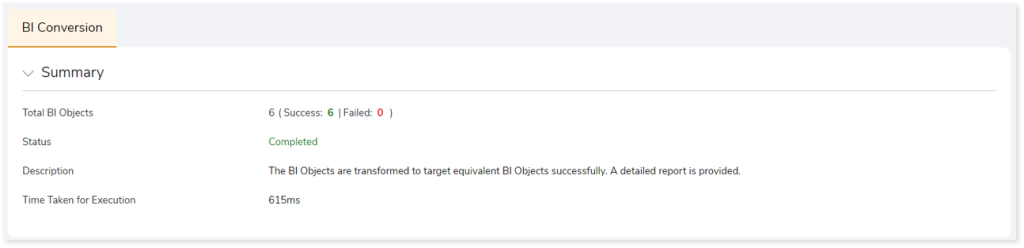
- Total BI Objects: Displays the number of BI objects in the source script. It also gives a segregated view of how many objects are successfully converted and how many failed.
- Status: Provides status of the BI Conversion stage.
- Description: A brief description of the stage is displayed.
- Time Taken for Execution: The time taken for execution.
In This Topic:
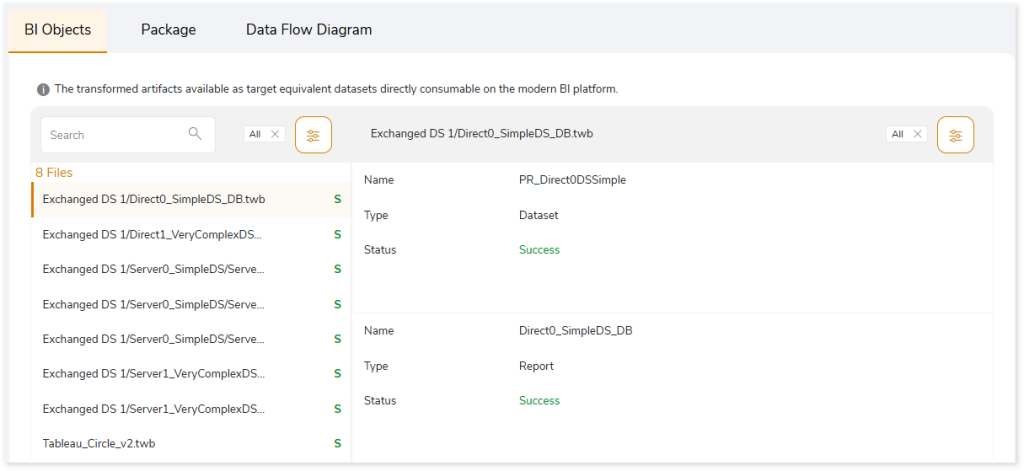
BI Objects
This section shows transformed artifacts containing datasets and analyses. The converted artifacts are directly consumable on the modern BI platform.
The left panel lists all the transformed artifacts along with their conversion status. The right panel provides information about datasets and analyses including their type and status.
In addition, if the dataset fails to convert, a remark is displayed with an error message to help you understand the error and fix it.
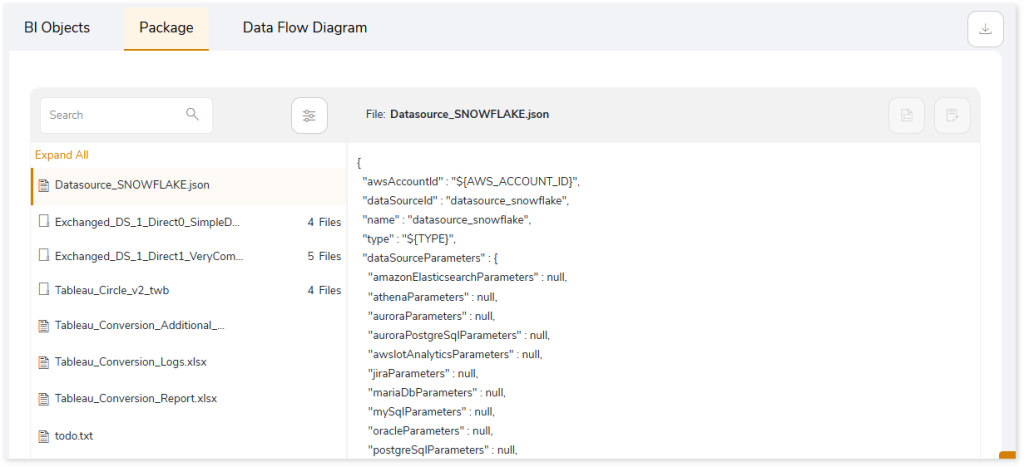
Package
This topic provides the converted datasets and dashboards in JSON file format which can be executed directly on the target platform. Select  to download the converted artifacts for offline use.
In the converted package, you can see Datasource.json, Analysis.json, Dataset.json reports along with the Logical_Dataset folder.
- Datasource.json (Datasource_SNOWFLAKE.json) contains information that is required to connect to the underlying database such as Snowflake from which QuickSight fetches the data.
- ANALYSIS.json contains converted artifacts that define the dashboards.
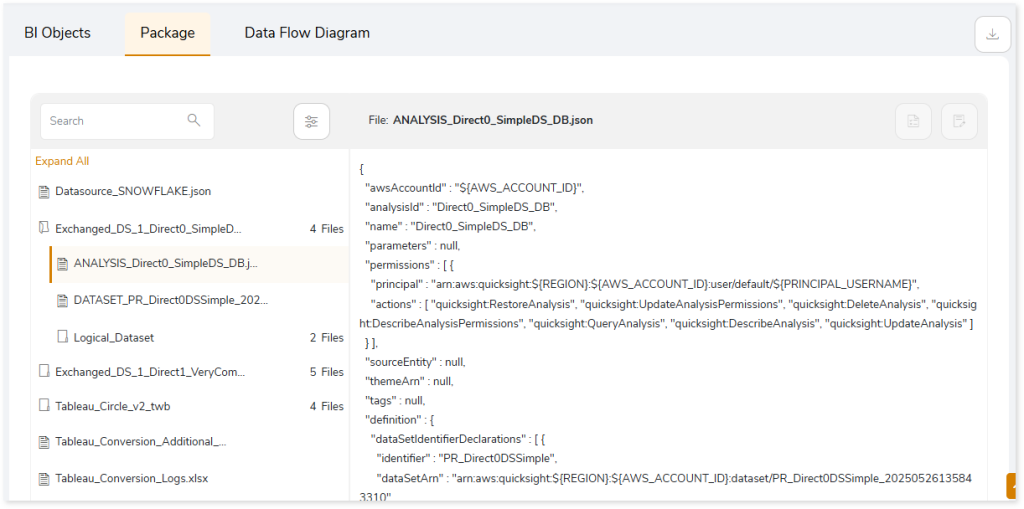
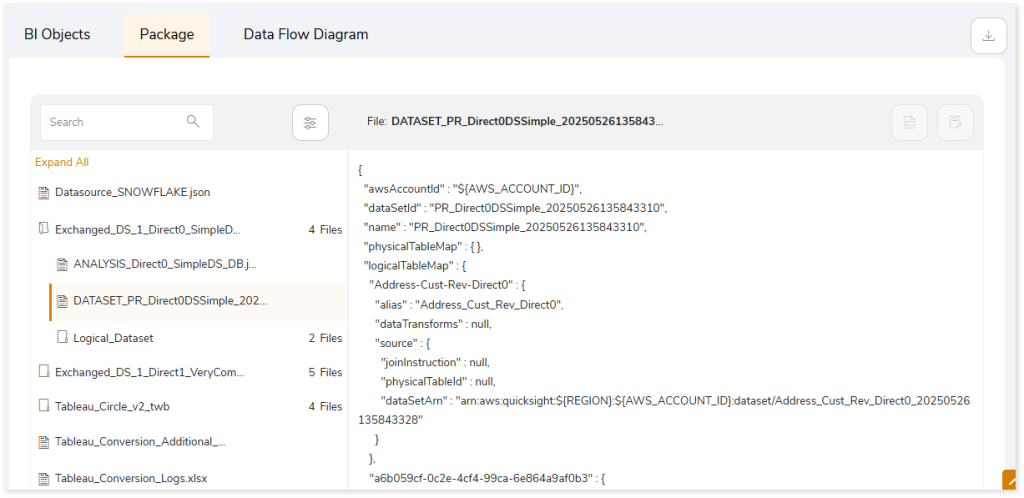
- DATASET.json contains converted artifacts with consolidated table details required for creating visuals.
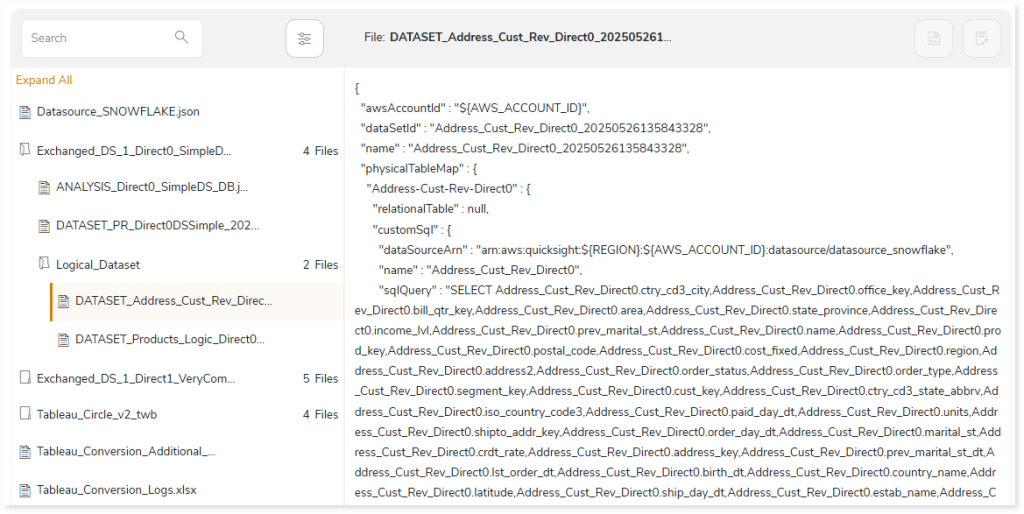
- Logical_Dataset folder contains converted artifacts in JSON format, each file representing a logical table.
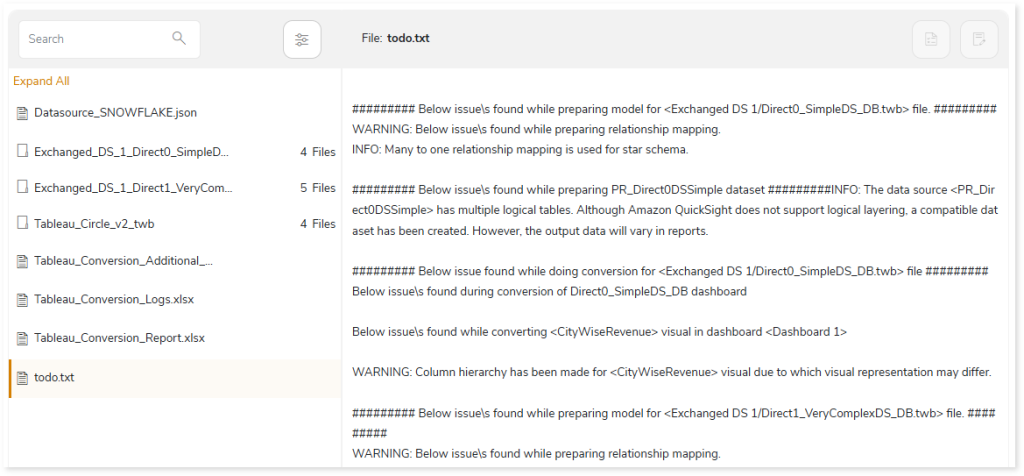
In addition, you can access the Tableau_Conversion_Additional_Help.xlsx, Tableau_Conversion_Logs.xlsx, and todo.txt reports, each offering detailed error specifications and troubleshooting information to help you quickly detect and resolve issues during code transformation.
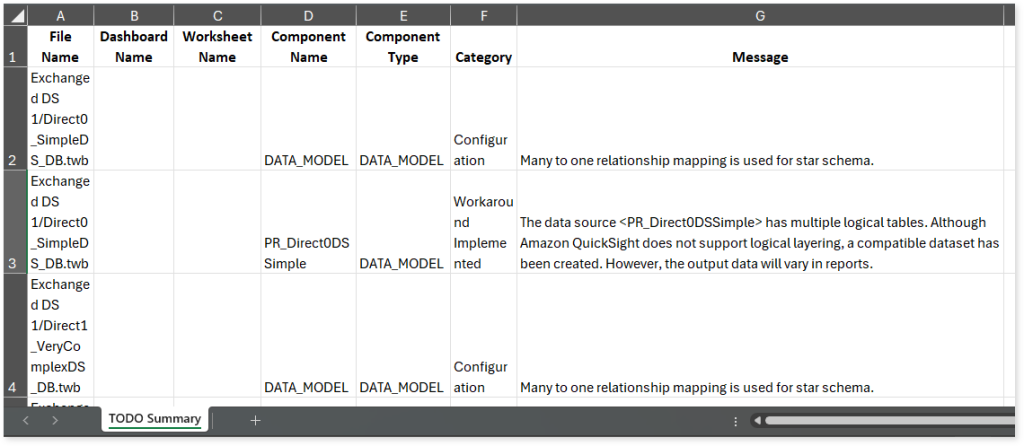
- The Tableau_Conversion_Additional_Help.xlsx report contains a detailed error specifications generated during the transformation process. Error specifications include:
- Error messages with clear explanations for quick issue resolution.
- Unsupported components or properties that cannot be auto converted and LeapLogic has not implemented alternative logic or methods for conversion.
- Technical limitations that prevent the conversion of certain properties or components.
- Partially supported components.
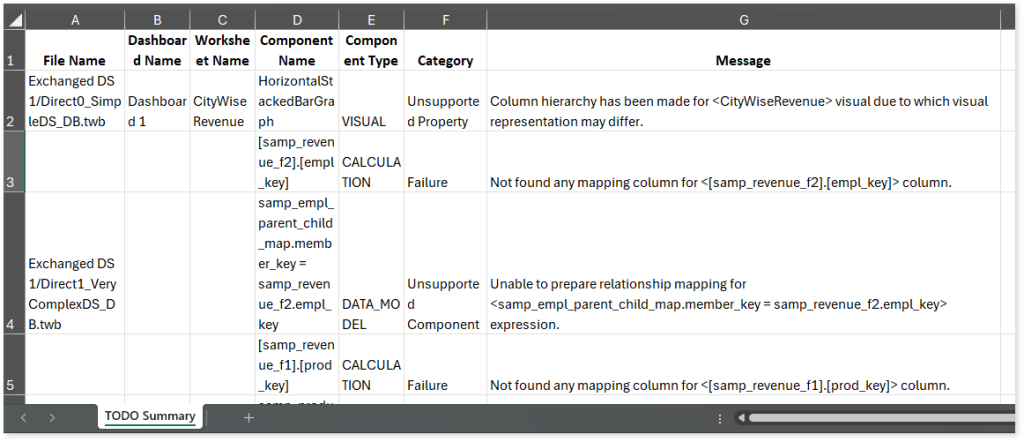
- The Tableau_Conversion_Logs.xlsx report contains information about the components or properties that are not supported in target environment and require manual intervention for successful conversion. In such cases, LeapLogic has implemented alternative logic or methods to convert the source components or properties to the target-equivalent.
- The todo.txt report contains all error messages and issues encountered during code transformation. It includes warnings, errors, alerts, and informational messages to guide further actions for the successful conversion of components or properties to the target equivalent.
In the Package section you can also see a Tableau_Conversion_Report.xlsx report which provides detailed information about the Tableau conversion including the number of total, failed, successfully transformed charts, visual objects, calculations, filters, and more. It also includes information about the automation level indicator along with deductible and deducted script quota.
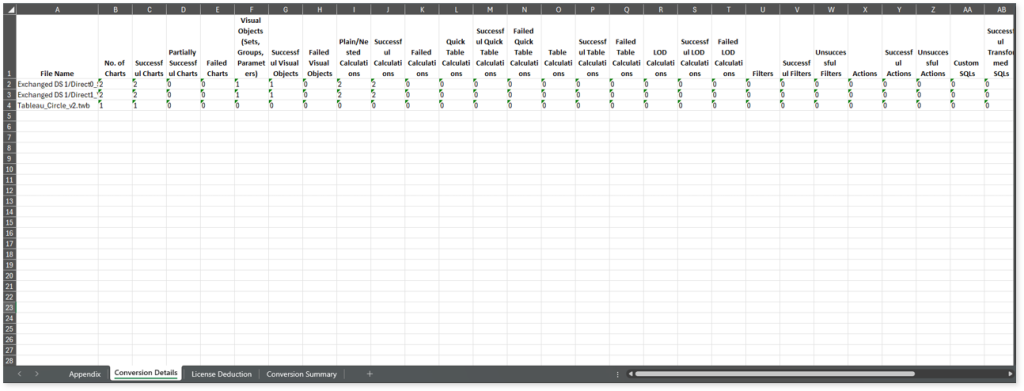
This report contains the following information:
- Appendix: Provides information about the weightage of each component used to calculate the conversion automation Percentage.
- Conversion Details: Provides information about the number of total, failed, successfully transformed charts, visual objects, calculations, filters, etc., along with the conversion automation percentage.
- License Deduction: Provides information about deductible script quota (the quota that needs to be deducted) and deducted script quota (the actual script quota deducted from the license).
- Conversion Summary: Provides the overall conversion automation percentage, i.e., the automation percentage calculated across all scripts.
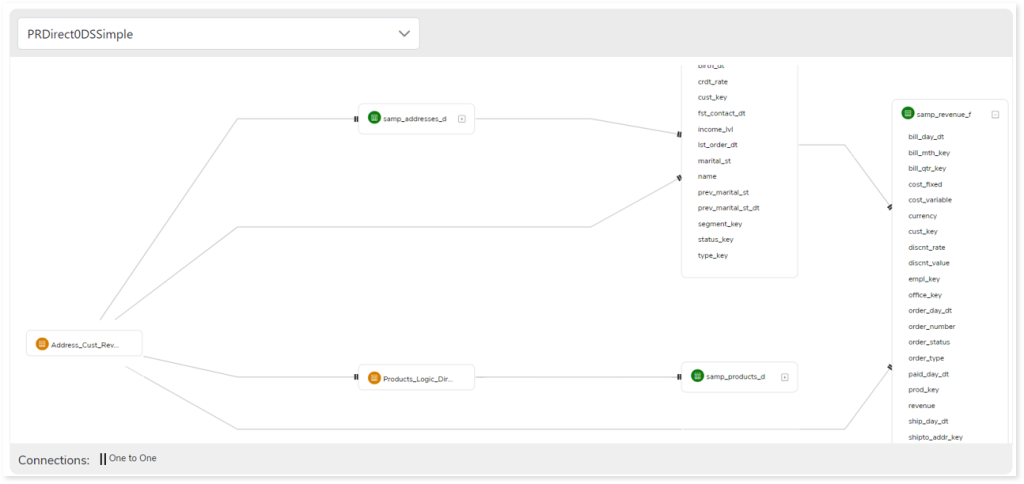
Data Flow Diagram
Here, you can see the entity relationship diagram for the dataset. This Data Flow Diagram gives a clear representation of data flow along with the cardinality.
Each Tableau file has one data source. That data source may contain multiple logical tables which are represented by orange colored table icons. Each logical table further has one or more physical tables, which is represented by a green colored table icon. The physical tables are connected using join condition whereas, logical tables are connected using relationships. Hover over the data flow link to view the relationship between tables.