OBIEE Assessment Report
This topic contains information about the OBIEE assessment report. The OBIEE assessment assesses both direct database connect and cube workloads, providing comprehensive insights that help in planning the migration process. The input format for the OBIEE assessment is XML.
To view the report of direct database connect or cube workloads, in Reporting Type, select:
- Direct Database Connect: It refers to querying and retrieving data directly from the database while executing reports or dashboards. This approach ensures the retrieval of real-time data, which is beneficial for dynamic and constantly changing datasets. However, as it directly fetches data from the database, this process may be relatively slow.
- Cube: Cube is used to store data in multidimensional format within the BI tool. So, instead of querying the database directly, the BI tool retrieves data from the cube. The cube undergoes periodic refreshment at specified intervals, resulting in enhanced performance compared to direct database connect approach. However, it does not provide the latest real-time data.

In This Topic:
Highlights
The highlights section gives you a high-level overview of your assessment summary of the analytics performed on the selected workloads including dashboards, reports, publishers, and so on.
Summary
This section highlights the OBIEE report’s components and its inventory. Here, you can see the number of files, tables, business models, subject areas, and so on.
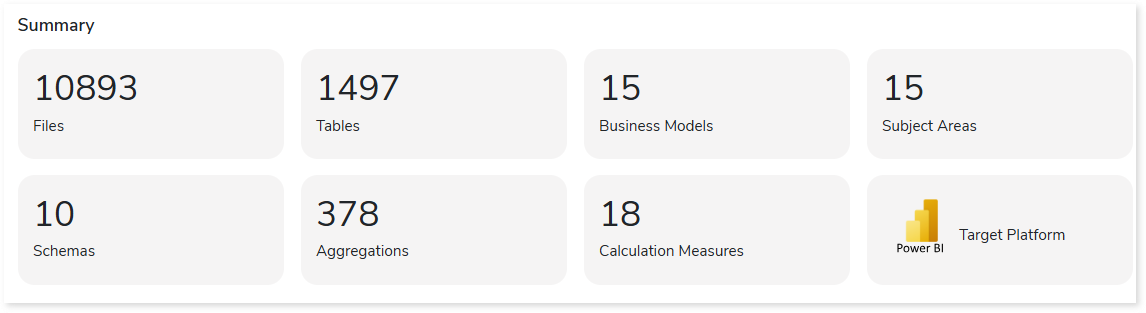
- Files: Displays the total number of source files.
- Tables: Displays the total number of tables that are imported from the OBIEE Admin Tool.
- Business Models: Displays the count of Business Models. Business models simplify the schema.
- Subject Areas: Displays the count of Subject Areas created in the Presentation Layer. It is a collection of tables relevant to a specific subject.
- Schemas: Displays the total number of unique schemas imported in the Physical Layer of the Admin Tool. It is a logical view of the database, where:
- Physical Layer: The physical layer represents the actual data sources such as databases, tables, and columns. Within this layer, connection pools define the connection details to the underlying data sources.
- Admin Tool: Admin Tool commonly known as Administration Tool or RPD (Repository) Tool, is a powerful desktop application used for creating and managing the metadata layer within an OBIEE system. This layer acts as an abstract layer between the raw data sources and the reporting tools, providing a logical view of the data.
- Aggregations: Displays the total number of aggregations such as sum, average, etc., within the model or the BI Report.
- Calculation Measures: Displays the total count of calculation measures used in the OBIEE Admin tool or in the Analytics Server. For example, a formula/ expression/ derivation written in the Admin tool (e.g., Sum(Column A – Column B) as Revenue) qualifies as a calculated measure. Where:
- Admin Tool: The Admin Tool commonly known as Administration Tool or RPD (Repository) Tool, is a powerful desktop application used for creating and managing the metadata layer within an OBIEE system. This layer acts as an abstract layer between the raw data sources and the reporting tools, providing a logical view of the data.
- OBIEE Analytics Server: OBIEE Analytics Server is a BI Reporting Tool. After creating your model in the Admin Tool, you deploy it to the BI tool/Analytics Server. Once deployed, you can proceed to create analyses and dashboards for visualization purposes.
- Target Platform: Displays the name of the target platform.
Dashboards
This section displays details of the dashboards including the total number of dashboards, valid and invalid dashboards along with the physical databases. The dashboard showcases a comprehensive overview of the report.
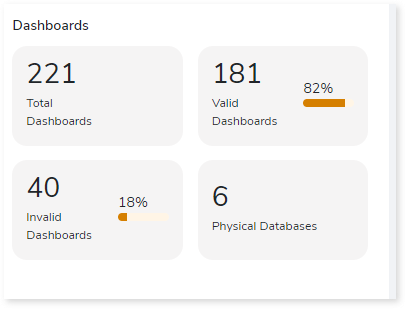
- Total Dashboards: Displays the total number of dashboards in the uploaded artifacts.
- Valid Dashboards: Displays the count and percentage of valid dashboards. Dashboards that are connected to a valid report are considered valid dashboards.
- Invalid Dashboards: Displays the count and percentage of invalid dashboards. Dashboards that are not connected to a valid report are considered invalid dashboards.
- Physical Databases: Displays the total number of physical databases imported into the physical layer.
Reports
This section displays details of the reports including the total number of reports, valid and invalid reports, used and unused reports along with the complexity distribution.
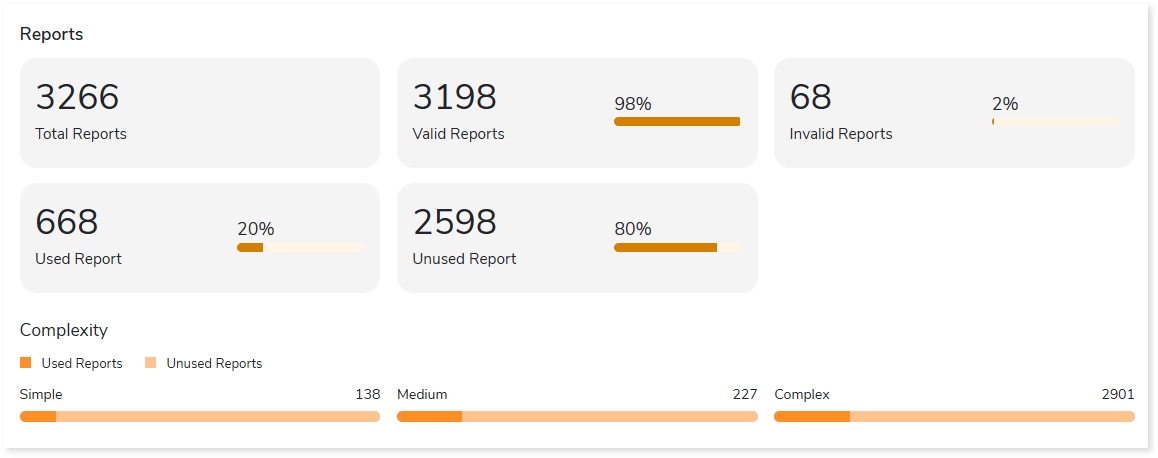
- Total Reports: Displays the total number of unique reports.
- Valid Reports: Displays the total number of valid reports. A report is considered valid if the columns defined in the report match or are available in the model.
- Invalid Reports: Displays the total number of invalid reports. A report is considered invalid if the columns defined in the report do not match or are not available in the model.
- Used Reports: Displays the total number of reports that are linked to a dashboard.
- Unused reports: Displays the total number of reports that are not linked to any dashboard.
- Complexity: Displays the complexity of the report. The reports are categorized into five different complexity levels based on key parameters such as the number of columns, filters, etc.
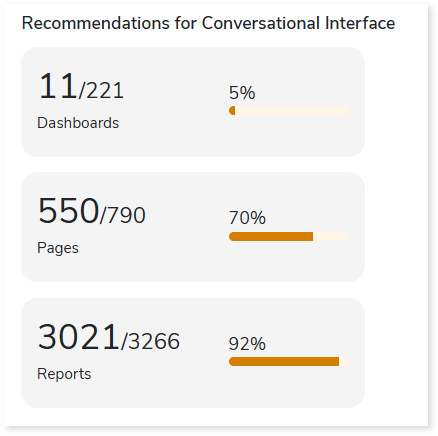
Recommendations for Conversational Interface
This section displays recommendations based on hierarchical structure for different report elements such as dashboards, pages, and reports. These insights help optimize scope and cost.
Publishers
In OBIEE, the Publisher feature provides advanced enterprise reporting functionalities. This section provides information about publisher models and publisher reports, where:
- Publisher models are objects that are used to manage data using a set of instructions such as dataset name, dataset type, variables, etc.
- Publisher reports are reports that are not based on the RPD model and possess their own model built on the Analytics server.
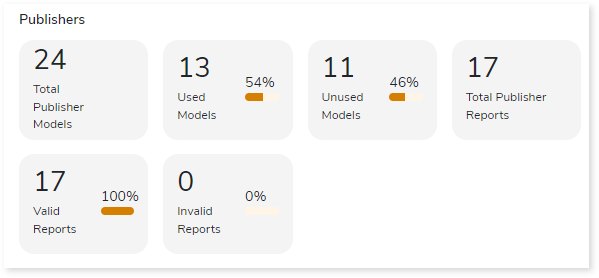
- Total Publisher Model: Displays the total number of publisher models. Publisher models are used for creating ad hoc reporting and it is not created using RPD.
- Used Models: Displays the total number of models linked to a report.
- Unused Models: Displays the total number of models that are not linked to any report.
- Total Publisher Reports: Provides the total number of publisher reports. These reports are based on the Publisher models rather than the RPD.
- Valid Reports: Displays the total number of valid reports. A report is considered valid if the columns defined in the report match or are available in the model.
- Invalid Reports: Displays the total number of invalid reports. A report is considered invalid if the columns defined in the report do not match or are not available in the model.
Presentation Tables
This section displays details of the presentation tables. The presentation tables showcase the processed data or result sets. Here, you can see the total number of presentation tables, used and unused tables along with their distribution across the subject areas.
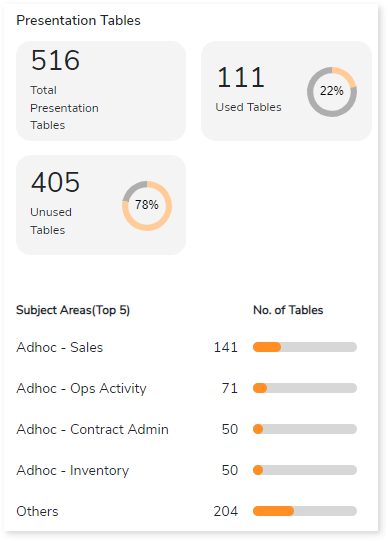
- Total Presentation Tables: Displays the total number of presentation tables used in the Logical layer of the RPD model.
- Used Tables: Displays the total count of tables used in reports across the Analytics server.
- Unused Tables: Displays the total number of tables that are not used in reports across the Analytics server.
- Subject Areas: Lists the top 5 subject areas along with the table count in the Presentation layer, arranged in descending order based on the table count.
Logical Tables
This section displays details of the logical tables, including the total number of logical tables, used and unused tables, and their distribution across table types. Logical tables display the transformed data. In other words, logical tables are created after applying a calculation or logical operation to the selected tables.
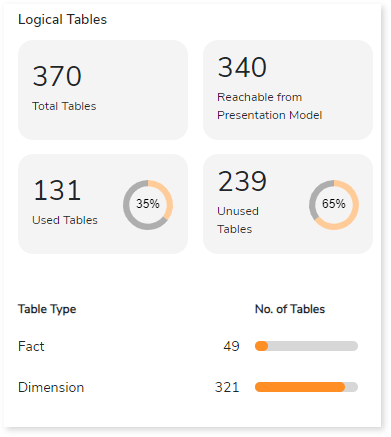
- Total Logical Tables: Displays the total number of logical tables used in the Business Model Mapping layer of the RPD model.
- Reachable from Presentation Model: Displays the total number of tables used in the presentation layer across all subject areas.
- Used Tables: Displays the total count of tables used in reports across the Analytics server.
- Unused Tables: Displays the total count of tables that are not used in reports across the Analytics server.
- Table Type: Provides a bifurcation of Facts vs Dimension tables used in the BMM layer along with their respective counts.
Physical Tables
This section displays details of the physical tables, including the total number of tables, used and unused tables, and their distribution across databases. The physical table displays the raw data in the physical layer or the extracted data from the database.
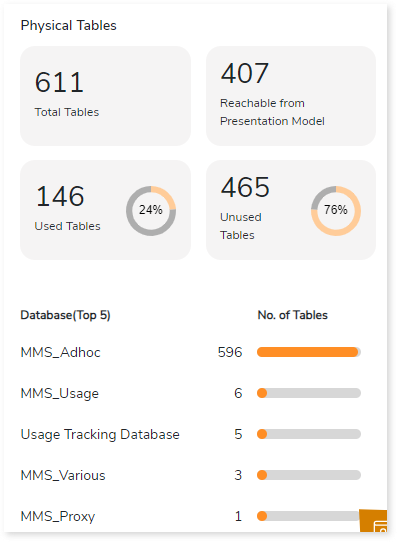
- Total Tables: Displays the total number of physical tables used in the Physical layer of the RPD model.
- Reachable from Presentation Model: Displays the total number of tables used in the presentation layer across all subject areas from the Physical layer.
- Used Tables: Displays the total count of tables used in reports across the Analytics server.
- Unused Tables: Displays the total count of tables that are not used in reports across the Analytics server.
- Database Name: Lists the top 5 databases based on the count of tables imported from each database.
Columns
This section provides details about the derived columns along with the distribution across the column type.
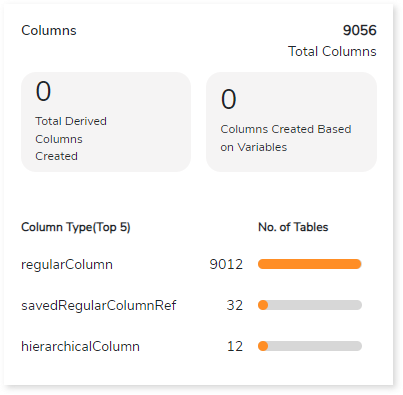
- Total Columns: Displays the total number of unique columns created in the Presentation layer of the RPD model.
- Total Derived Columns Created: Displays the count of total columns that are calculated or derived in the model or in the Analytics Server.
- Columns Created Based on Variables: Provides the total number of columns where variables are used. Variables act as parameters or placeholders, enabling dynamic and flexible interactions within the BI environment. They facilitate the customization of analyses, dashboards, and reports based on user input, session-specific details, or other dynamic criteria.
- Column Type: Displays the different types of columns and its table count in descending order.
Filters
This section provides details about the filters including used and unused filters. The filters contain SQL expressions such as Where clause to filter out data.
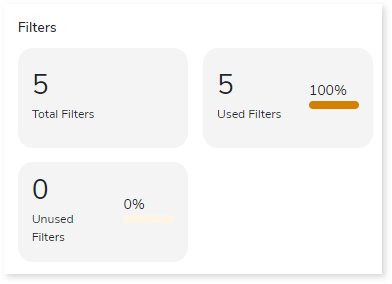
- Total Number of Filters: Displays the total number of filters created in the uploaded artifacts.
- Used Filters: Displays the total number of filters used in reports.
- Unused Filters: Displays the total number of filters that are created but not used in the reports.
Agents
This section provides details about the agents including valid agents, used agents, and the total number of recipients. It is an automated process to deliver the reports and dashboard to specific recipients.
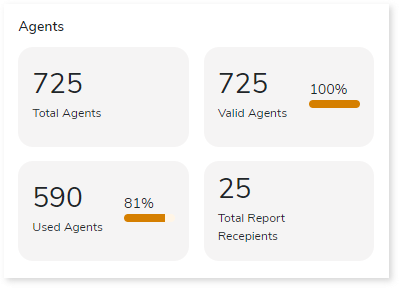
- Total Agents: Displays the total number of agents created in the uploaded artifacts. Agents enable proactive intelligence to automate the delivery of relevant and personalized business intelligence content to recipients. They monitor predefined conditions or events and trigger actions or notifications based on those conditions.
- Valid Agents: Displays the total number of agents that are valid. An agent is considered valid, if the columns/ reports mentioned in the agents are present in the uploaded artifacts.
- Used Agents: Displays the total number of agents utilized in any report or dashboard. An agent is considered used if it is used or incorporated into a report or dashboard.
- Total Report Recipients: Displays the total count of reports where an agent has been used.
Analysis
This topic provides a detailed examination of source files, dashboards, reports, and more.
Files
This section provides a comprehensive report of the source file including file name, number of physical tables, presentation tables, logical tables, and so on.
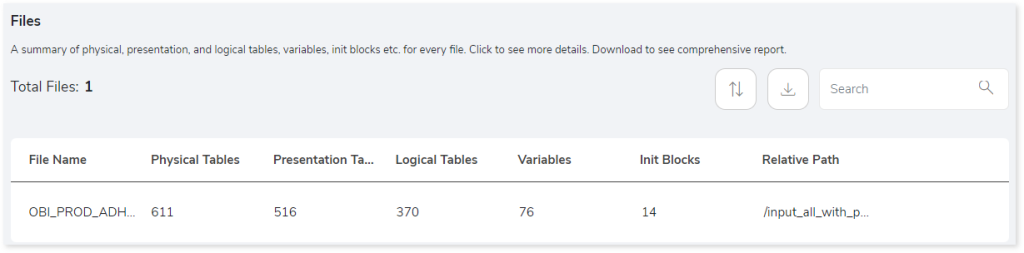
- File Name: Displays the name of the uploaded RPD file.
- Physical Tables: Displays the total number of physical tables in the physical layer of the RPD model.
- Presentation Table: Displays the total number of presentation tables in each subject area within the presentation layer of the RPD model.
- Logical Tables: Displays the total number of logical tables in each subject area within the Business Model Mapping layer of the RPD Model.
- Variables: Displays the total number of variables created in the RPD model.
- Init Blocks: Displays the total number of init blocks created in the RPD model. Init blocks are used to create variables.
- Relative Path: Provides the relative path of the RPD model.
Browse through the files to get more insights into the variables and init blocks present in the file.
Variables
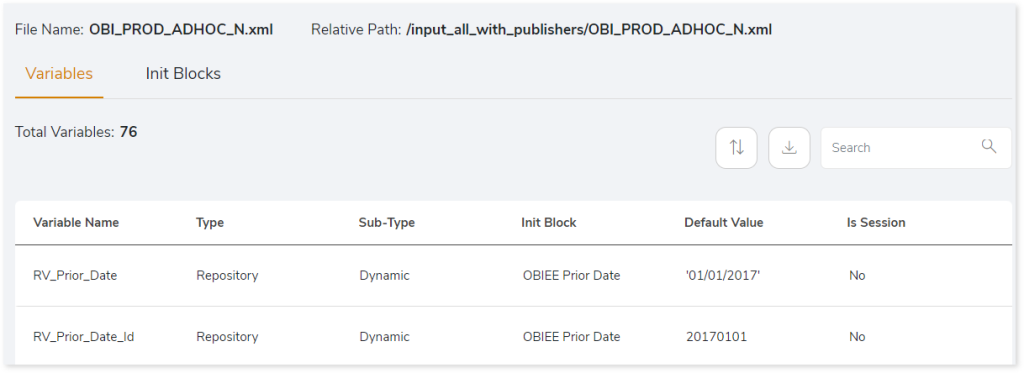
- Variable Name: Displays the name of the variable created in the RPD model.
- Type: Displays the type of variables such as repository or session.
- Repository: Repository variables store values in a particular location.
- Session: Variables are passed or stored within a particular individual session.
- Sub-Type: Displays the sub-type of the variables such as System, Non-System, Static, and Dynamic.
- System: It is a type of section variable where the variables are driven by the system.
- Non-System: It is a type of section variable where the values are defined by the developers.
- Dynamic: It is a type of repository variable where the values are provided as dynamic input to generate the required result.
- Static: It is a type of repository variable where the values are static and only the administrator can change it.
- Init Block: Displays the name of the init block used in the variable. In OBIEE, init blocks can be created and utilized across multiple variables.
- Default Value: Displays the default value of the variable, which is passed to the report or dashboard when it is initially loaded.
- Is Session: Indicates whether the variable is created for a specific set of users based on certain criteria. If this applies, the value is displayed as Yes; otherwise, No.
Init Blocks
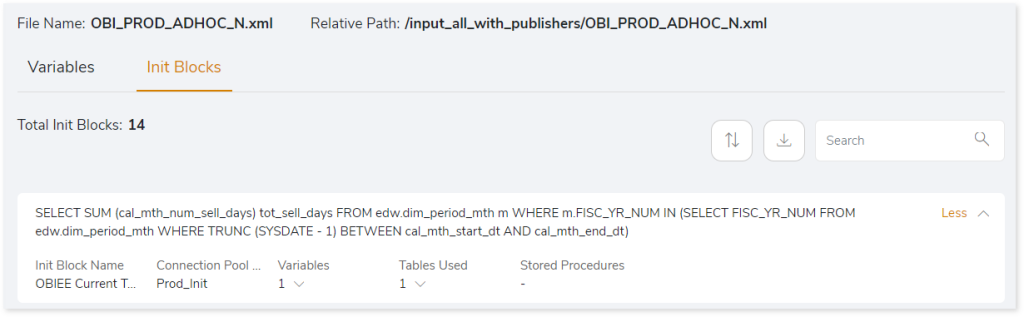
- Init Block Name: Displays the name of the Init block.
- Connection Pool Name: Displays the name of the connection pool associated with creating the init block.
- Variables: Displays the number of variables used in the init block.
- Tables Used: Displays the number of tables used in the init block.
- Stored Procedure: Displays the number of the stored procedure.
Dashboards
This section provides a comprehensive report of the dashboards including dashboard name, subject area, number of dashboard pages, and so on.
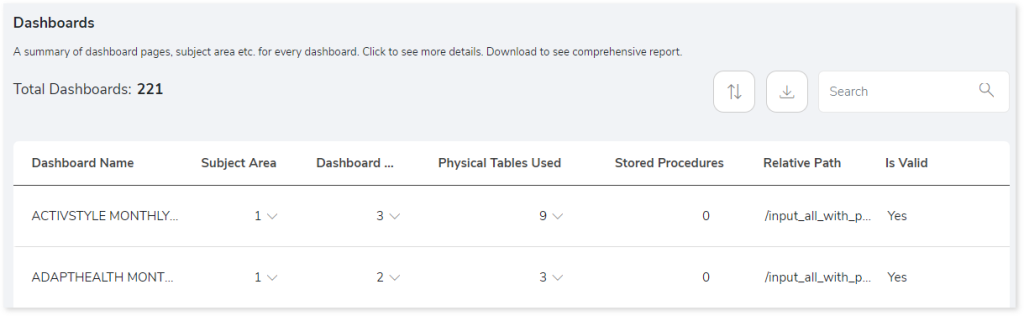
- Dashboard Name: Displays the name of the dashboard.
- Subject Area: Displays the count of subject areas used in the dashboard. It is a collection of tables relevant to a specific subject. Click on the count to view the names of each subject area.
- Dashboard Pages: Displays the number of dashboard pages created in the specific dashboard. Click the count to view the names of each dashboard page.
- Physical Tables Used: Displays the number of physical tables used in the specific dashboard. Click the count to view the list of names of the physical tables.
- Stored Procedures: Displays the number of stored procedures used in the Dashboard.
- Relative Path: Provides the relative path of the dashboard, which is in the folder structure.
- Is Valid: Displays the status of dashboard validity.
Browse through the dashboard to get more insight into the dashboard pages.
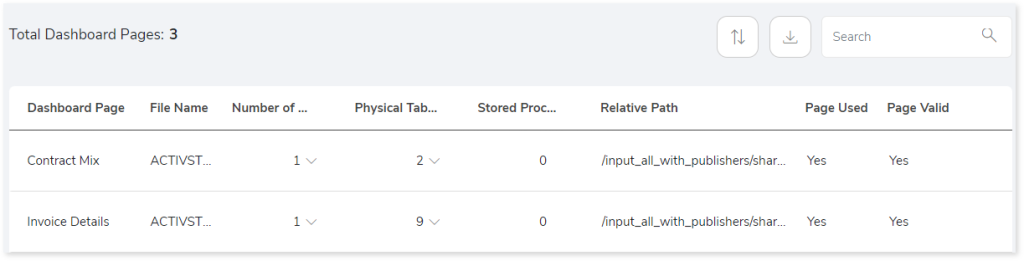
- Dashboard Page: Displays the name of the dashboard page.
- File Name: Name of the file in which the dashboard is created, which is usually different from the dashboard page name.
- Number of Reports: Provides the number of reports linked to the dashboard page. Click on the count to view the names of the reports.
- Physical Tables Used: Provides the number of physical tables used on the dashboard page.
- Stored Procedures: Provides the number of stored procedures linked to the dashboard page. Click on the count to see the names of the stored procedures.
- Relative Path: Provides the relative path of the dashboard, which is in the folder structure.
- Page Used: Provides the status regarding the usage of the dashboard pages. This field displays Yes if the report is connected to the dashboard page, and No if the dashboard page is blank.
- Page Valid: This field indicates whether the associated report is in a working state. It displays Yes if the report connected to the page is functional and No if it is not operational.
Browse through the dashboard pages to get more insight into the reports.
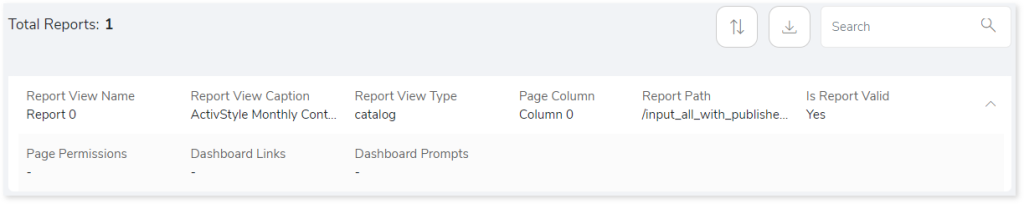
- Report View Name: Displays the name of the report.
- Report View Caption: Displays the caption or description of the report.
- Report View Type: Provide information about the type of report such as catalog.
- Page Column: Determines the column on the page where the report starts.
- Report Path: Provides the physical path of the report.
- Is Report Valid: Indicates the validity of the report. If the column in the report matches the column in the RPD model, then the report is valid, and it displays Yes; otherwise, it displays No.
- Page Permissions: Indicates whether specific permissions (such as access restrictions) are applied to view the page.
- Dashboard Links: If a dashboard links to another dashboard, then it displays Yes; otherwise, it displays No.
- Dashboard Prompts: Displays the status of the dashboard prompts. If there is a prompt, typically a selection made by you when running the dashboard, it will be indicated as Yes; otherwise NO.
Reports
This section provides details about reports including report name, subject area, complexity, and so on.
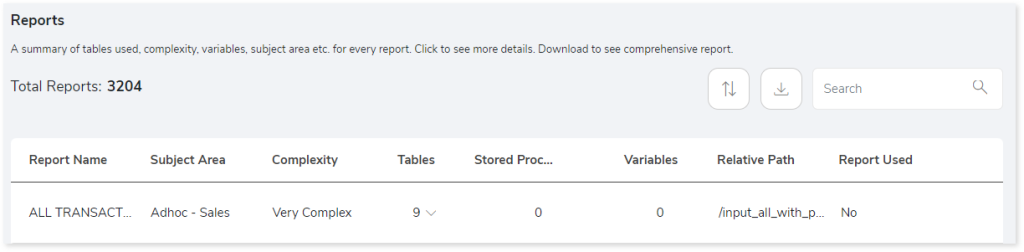
- Report Name: Displays the name of the report.
- Subject Area: Displays the count of subject areas associated with the report. It is a collection of tables relevant to a specific subject.
- Complexity: Displays the complexity of the report based on the patterns of the report and model.
- Tables: Displays the number of presentation tables used in the report. Click on the count to view the list of table names.
- Stored Procedures: Displays the number of stored procedures used in the report. Click on the count to view the list of stored procedure names.
- Variables: Displays the number of variables used in the report. Click on the count to view the list of variable names.
- Relative Path: Provides the relative path to the report, which is in a folder structure.
- Report Used: Status of the report’s usage. If the report is linked to a dashboard, then the value is Yes else it is No.
Navigate through each report to get more insights into tables used in the report.
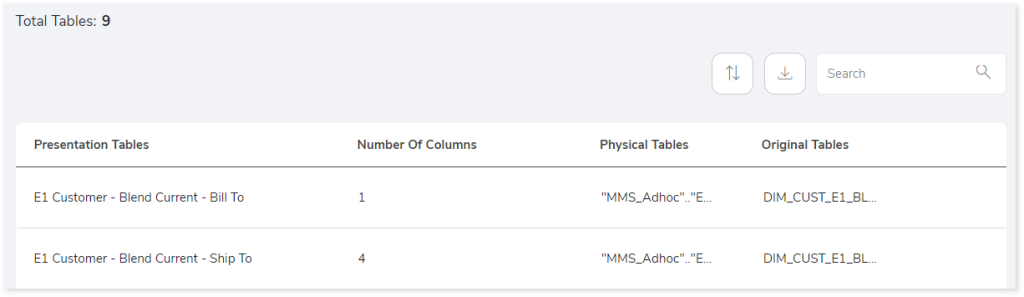
- Presentation Tables: Displays the name of presentation tables used in the report.
- Number of Columns: Displays the number of columns present in the presentation tables within the RPD model.
- Physical Tables: Displays the name of the physical tables used to create the presentation table. If there are multiple physical tables, then it will be listed as comma separated values.
- Original Tables: Displays the name of the original tables linked to the physical tables that match the database tables.
Navigate through each table to get more insights into the columns present on the table.
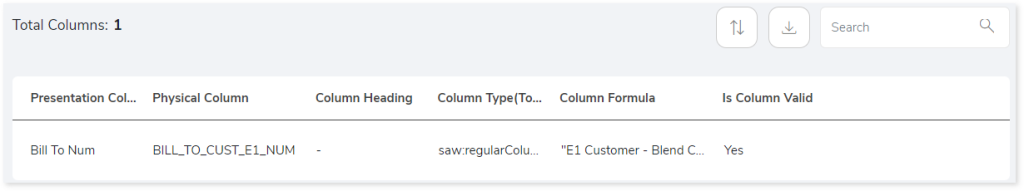
- Presentation Column: Displays the name of the column in the presentation table.
- Physical Column: Displays the name of the physical column.
- Column Heading: Displays the heading of the physical column.
- Column Type: Displays the type of column, typically categorized as column or derived column.
- Column Formula: If the column is a derived column, then this field displays the formula used to derive the column.
- Is Column Valid: Displays the validity of the column. If the column exists in the presentation layer but not in the physical layer, then it displays No; otherwise, it displays Yes.
Entities
This section provides a comprehensive report of the entities including physical, presentation, and logical tables, along with the missing tables.
Presentation Table
This section displays a detailed analysis of the presentation table comprising of used and unused tables.
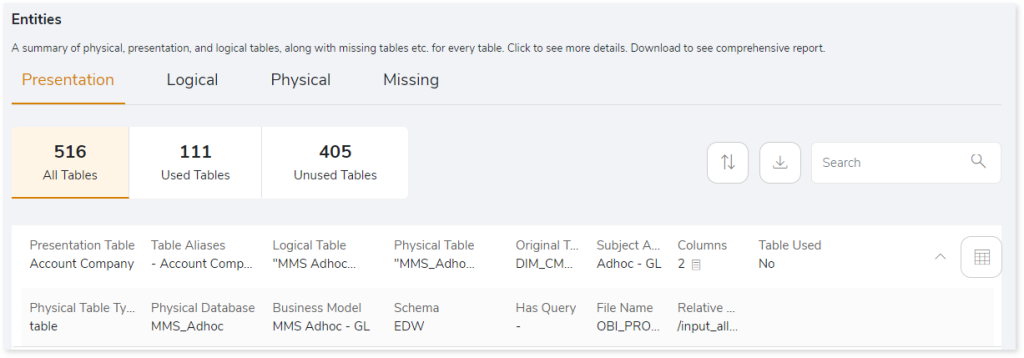
- Presentation Table: Displays the name of the presentation table.
- Table Aliases: Displays the table aliases name for each presentation table.
- Logical Table: Displays the name of the logical table associated with the presentation table.
- Physical Table: Displays the name of the physical table associated with the presentation table.
- Original Table: Displays the name of the original table associated with the presentation table.
- Subject Area: Displays the name of the subject area related to a presentation table.
- Column: Displays the number of columns present in the presentation table. Click on the count to view the names of all the columns pertaining to that presentation table.
- Table Used: Indicates whether the presentation table is used in any report. It displays Yes if the table is used in a report; otherwise, it displays No.
- Physical Table Type: Provides the type of physical table such as view or table.
- Physical Database: Displays the database name from which the original table was derived.
- Business Model: Displays the name of the Business Model associated with the presentation table in the BMM Layer.
- Schema: Displays the schema name of the presentation table retrieved from the database.
- Has Query: Displays the query if the presentation table is derived from a SELECT query.
- File Name: Displays the file name of the RPD model.
- Relative path: Displays the relative path of the report, which is in the folder structure.
Click  (table icon) in each row to get more details about the presentation table.
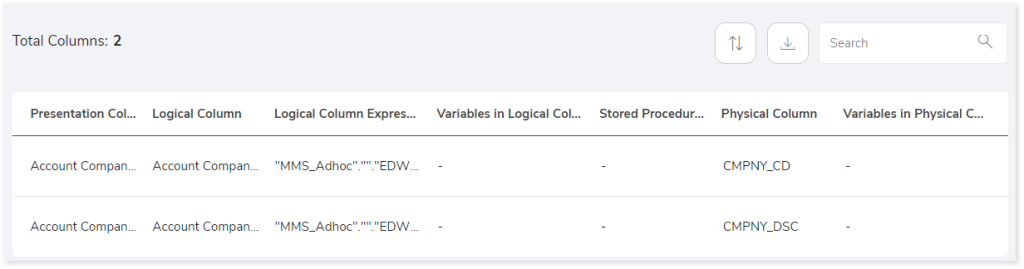
- Presentation Columns: Displays the name of each presentation column associated with the presentation table in each row.
- Logical Column: Displays the name of the logical column associated with the presentation column.
- Logical Column Expression: Displays the expression of the logical column, regardless of whether the column is derived or not.
- Variables in Logical Column: Displays the variable name if it is used to create the logical column.
- Stored Procedure: Displays the name of the stored procedure if the column is derived from a stored procedure.
- Physical Column: Displays the name of the physical column associated with the Presentation table.
- Variables in Physical column: Displays the variable name if it is used to create the physical column.
Logical Table
This section displays a detailed analysis of the logical table comprising of used and unused tables.
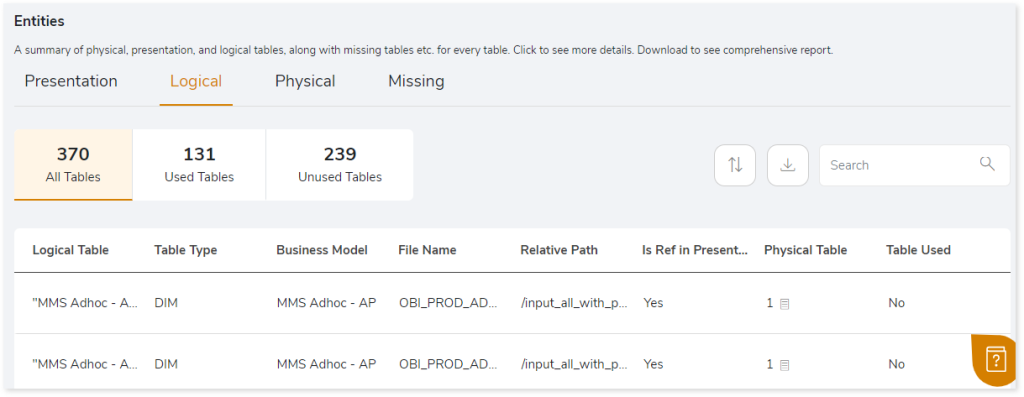
- Logical Table: Displays the name of the logical table in the RPD model.
- Table Type: Provides the type of the table such as DIM, FACT.
- Business Model: Provides the associated business model in the BMM Layer.
- File Name: Displays the name of the file which is exported as part of the RPD model.
- Relative Path: Provides the directory or folder path of the RPD model.
- Is Ref in Presentation Table: Indicates whether the logical table is utilized in the presentation layer. Displays Yes if it is used, otherwise No.
- Physical Table: Displays the number of physical tables. Click on the count to view the names of all physical tables used in the logical table.
- Table Used: Indicates whether the table is utilized in any report. Display Yes if the table is used, otherwise, No.
Browse through the logical table to get more insights about the tables.
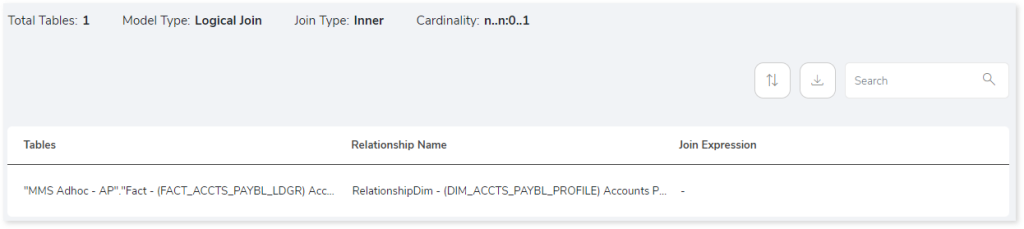
- Total Tables: Displays the total number of tables.
- Model Type: Displays the type of join such as Logical Join or Physical Join.
- Join Type: Displays the Join types such as Left, Inner, Right, or Full.
- Cardinality: Displays the cardinality of the logical table.
- Tables: Displays the logical table name.
- Relationship Name: Displays the relationship name.
- Join Expression: Displays the expression used for the join, such as “column a = column b”.
Physical Table
This section displays a detailed analysis of the physical table comprising of used and unused tables.
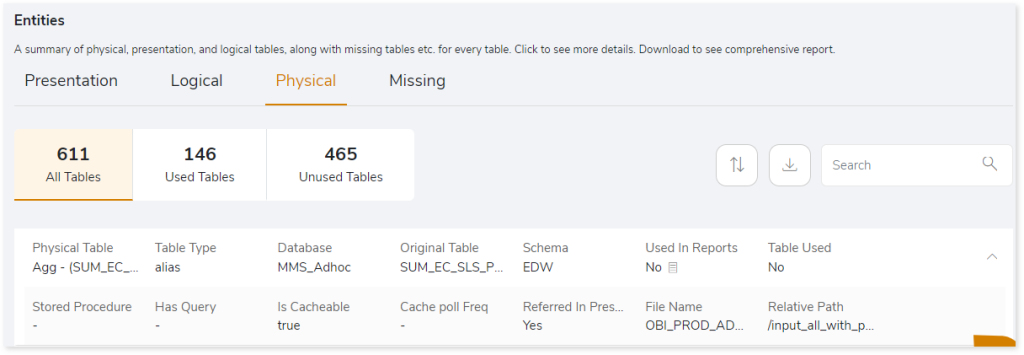
- Physical Table: Displays the name of the physical table.
- Table Type: Provides the type of table such as alias or table. In OBIEE, tables can be duplicated based on requirements, and these duplicated tables are referred to as aliases.
- Database: Provides details about the database of the physical table.
- Original Table: Displays the original table name associated with the physical table.
- Schema: Provides the schema of the database related to the physical table.
- Used in Reports: Provides details about whether the table is used in any reports. Clicking on the value will open a popup displaying the names of the reports where the table has been utilized.
- Table Used: Shows whether the table is used in any reports. Displays Yes if the table is used, otherwise No.
- Stored Procedure: Indicates whether the table has stored procedures. If the table has stored procedures, it displays Yes; otherwise, No.
- Has Query: Indicates whether the table has query. Displays Yes if the table has queries; otherwise, No.
- Is Cacheable: Cache is a feature which stores data in temporary memory. Displays Yes if the table is cached; otherwise, No.
- Cache Poll Freq: The cache frequency determines the duration for which data will be retained in the cache. It will refresh the data after a specific time interval. If the Cache Poll Freq is set to 10 minutes, the tables will refresh every 10 minutes to update the data.
- Referred In Presentation Table: Indicates whether the physical table is used in the Presentation layer. Displays Yes if the Physical table is used in the Presentation layer, otherwise No.
- File Name: Displays the name of the associated file.
- Relative Path: Provides the relative path, which is in the folder structure.
Missing Table
This section displays a list of all missing tables.
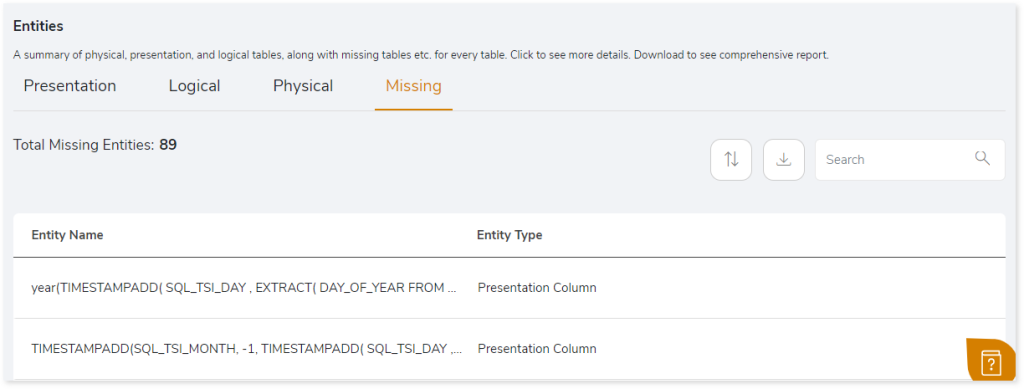
- Entity Name: Displays the name of the missing entity.
- Entity Type: Displays the type of missing entity. If a column is missing, it will be labeled as Presentation column. If a report is missing, then the report name and its path will be provided.
Publisher
This section provides details about the Model and Report. Publisher provides sophisticated enterprise reporting capabilities.
Model
Publisher models are objects that are used to manage data using a set of instructions such as dataset name, dataset type, variables, etc. Additionally, it categorizes the model into the used and unused models.
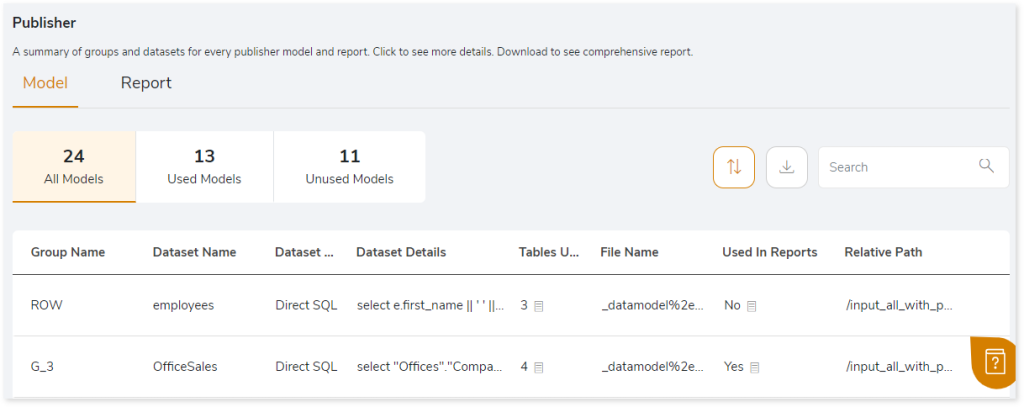
- Group Name: Displays the group name of the publisher model.
- Dataset Name: Displays the dataset name of the publisher model.
- Dataset Type: Displays the database type such as Direct SQL or File.
- Dataset Details: Displays details about the dataset. For example, if the dataset comprises SQL queries, then the value will be the entire SQL query. If it reads data from a file, then this will display the file name.
- Tables Used: Displays the number of tables used in the dataset. Click on the count to see the table names. If the entity is a file, then this field will be blank.
- File Name: Displays the file name where the model is present.
- Used In Reports: Indicates whether the model is used in any report or not. Displays Yes if the model is used in the report, otherwise, No. Click on the value to view the report name and path.
- Relative Path: Displays the path of the file or directory.
Browse through the publisher model to get more insights into reports.
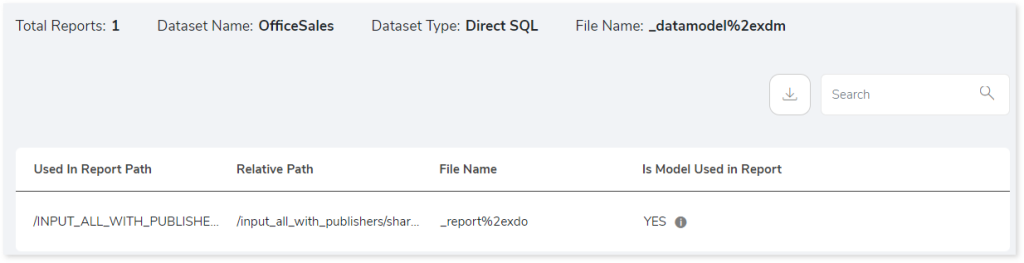
- Used in Report Path: Displays the path of the report where the report is located.
- Relative Path: Displays the relative path.
- File Name: Displays the associated file name.
- Is Model Used in Report: Indicates whether the model is used in any report or not. Displays Yes if the model is used in the report, otherwise, No.
Report
Publisher reports contain enterprise reports. Additionally, it categorizes the report into the valid and invalid reports.
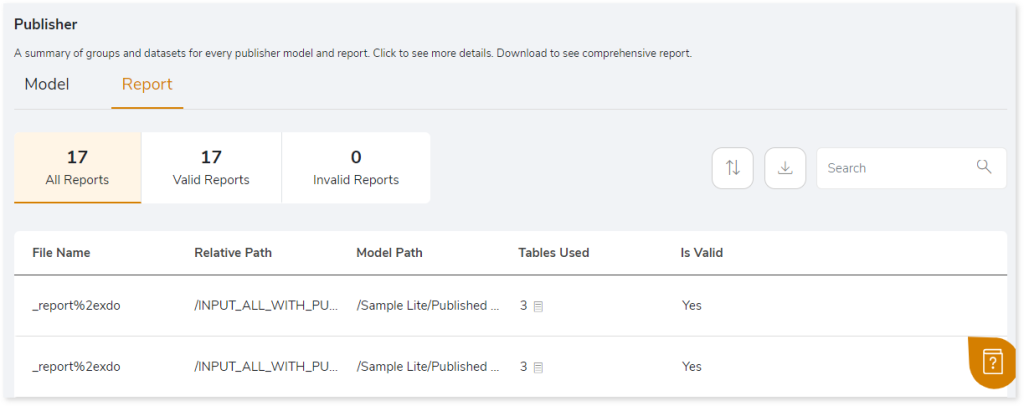
- File Name: Displays the file name.
- Relative Path: Displays the relative path of the report.
- Model Path: Displays the path of the model used in the report.
- Table Used: Displays the number of tables used in the report. Click on the count to see the table names.
- Is Valid: If any column referenced in the report is not present in the model, the report becomes inactive and displays No, otherwise, it displays Yes.
Agents
Agents are scheduled events or triggers within the events. This section provides details about the agents including valid agents, and invalid agents. It is an automated process to deliver the reports and dashboard to specific recipients.
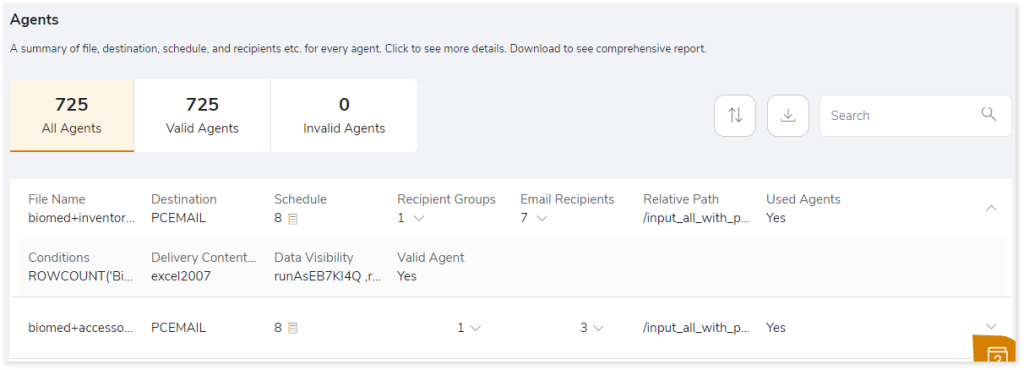
- File Name: Displays the file name.
- Destination: Displays the destination name.
- Schedule: Displays the count of schedules set for automated tasks or events. Clicking on the count will display the complete list of schedules.
- Recipient Groups: Displays the number of recipient groups. Clicking on the count will display the complete list of recipient groups.
- Email Recipients: Displays the number of email recipient groups. Clicking on the count will display the complete list of email recipients.
- Relative Path: Displays the relative path of the agent.
- Used Agents: Displays Yes if the agent is used, otherwise, No.
- Conditions: Displays the conditions under which the agent should run.
- Delivery Content Format: After the agent runs, it exports content in a specific format, such as Excel or PDF.
- Data Visibility: Displays the data visibility value.
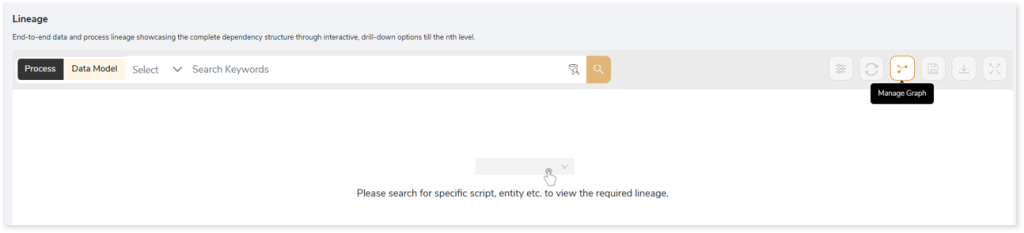
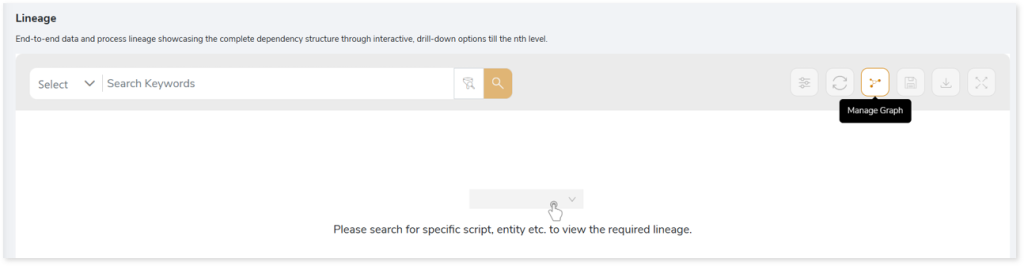
Lineage
End-to-end data and process lineage identify the complete dependency structure through interactive and drill-down options to the last level.
Typically, even within one line of business, multiple data sources, entry points, ETL tools, and orchestration mechanisms exist. Decoding this complex data web and translating it into a simple visual flow can be extremely challenging during large-scale modernization programs. The visual lineage graph adds tremendous value and helps define the roadmap to the modern data architecture. It deep dives into all the existing flows, like Autosys jobs, applications, ETL scripts, BTEQ/Shell (KSH) scripts, procedures, input and output tables, and provides integrated insights. These insights help data teams make strategic decisions with greater accuracy and completeness. Enterprises can proactively leverage integrated analysis to mitigate the risks associated with migration and avoid business disruption.
Now, let’s see how you can efficiently manage lineage.
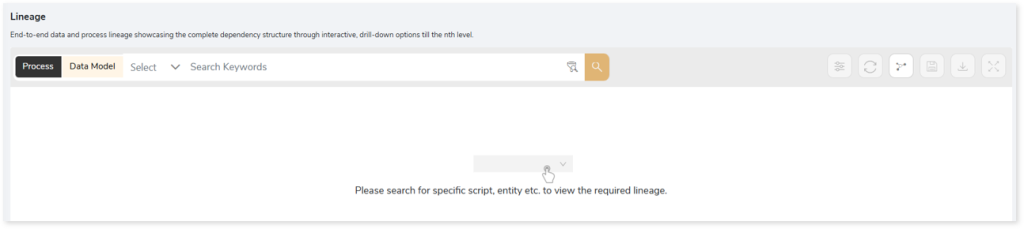
To view the required lineage:
- Select either the Process or Data Model tab.
- Enter the keywords in the Search Keywords field.
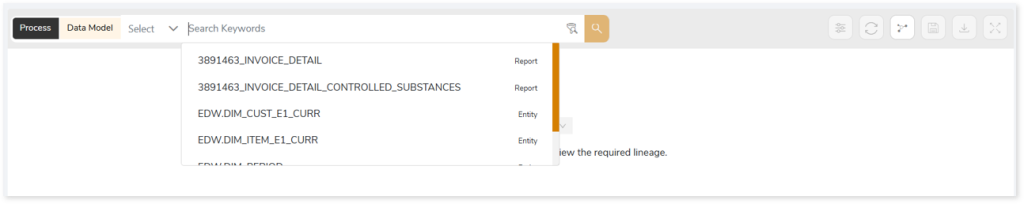
- Click the Search icon to generate the lineage.

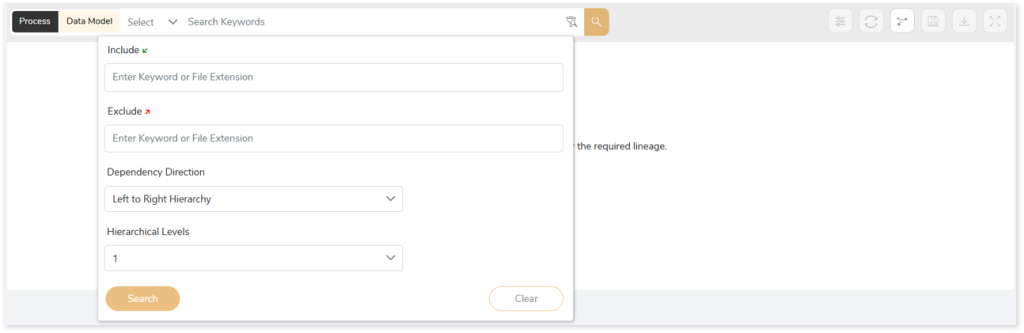
In addition, the filter search icon allows you to include or exclude particular nodes to obtain the required dependency structure. You can also choose the direction of the lineage. By default, the Dependency Direction is Left to Right Hierarchy. You can also choose Right to Left Hierarchy or Bidirectional dependency directions as required. Moreover, you can also increase the Hierarchy Levels to nth level.
Lineage facilitates you visualize how your selected nodes are connected and depend on each other. The nodes and their connecting edges (relationships) help you to understand the overall structure and dependencies.
|
Nodes |
Edges |
 Column Column |
 Call Call |
 Physical Table Physical Table |
 Read Read |
 Logical Table Logical Table |
 Execute Execute |
 Presentation Table Presentation Table |
 Write Write |
|
|
 OTHER OTHER |
Manage Lineage
This feature enables you to view and manage your lineage. You can add, modify, or delete nodes and their relationships to generate an accurate representation of the required dependency structure. There are two ways to update the lineage: either using Complete Lineage report or Lineage Template.
Using Complete Lineage report
Follow the below steps to modify the lineage:
- Click the Manage Graph icon.
- Click Download Complete Lineage to update, add, or delete the nodes and their relationships in the current lineage.

- Once the complete lineage report is downloaded, you can make necessary updates such as updating, deleting or adding the nodes and its relationships.
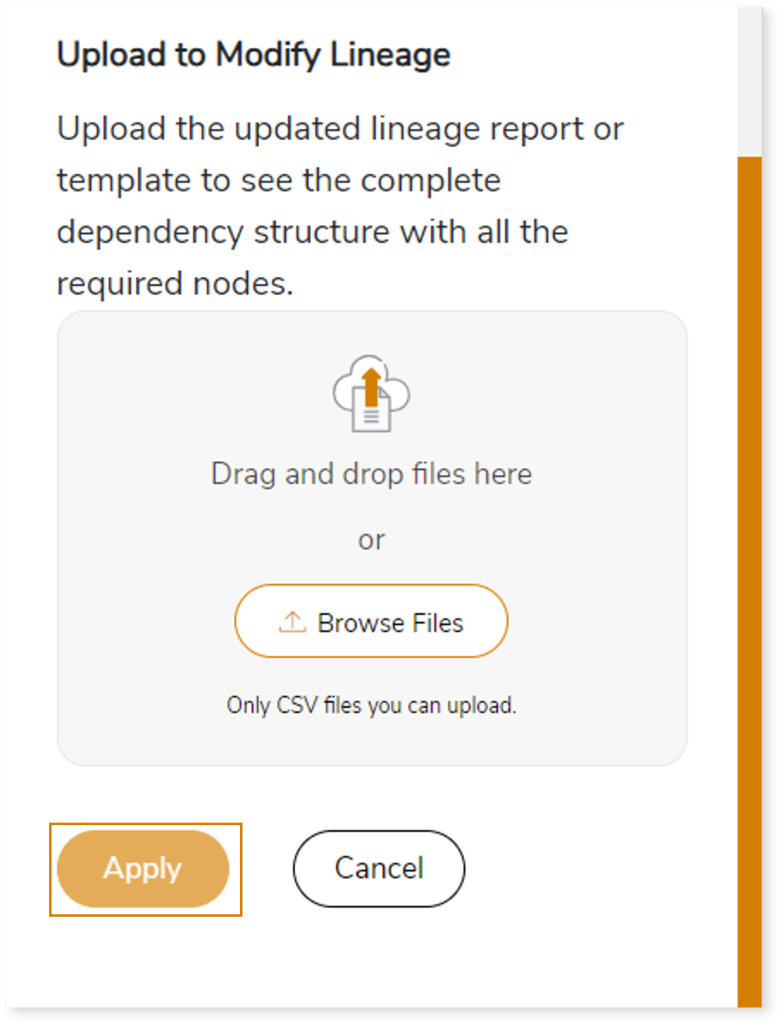
- After making the required changes, upload the updated lineage report in Upload to Modify Lineage.
- Click Apply to incorporate the updates into the dependency structure.
- Generate the required lineage.

Using Lineage Template
Follow the below steps to add new nodes and their relationships to the current lineage report:
- Click the Manage Graph icon.
- Click Download Lineage Template.
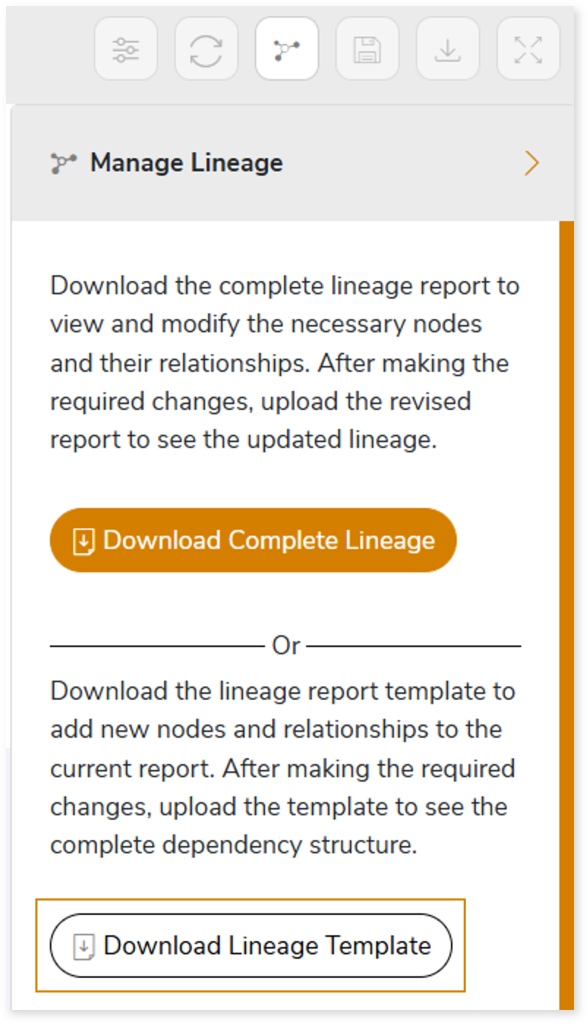
- Once the lineage template is downloaded, you can add new nodes and relationships in the template.
- After making the required changes, upload the template in Upload to Modify Lineage.
- Click Apply to incorporate the updates into the complete dependency structure.
- Generate the required lineage.
You can also apply:
| Feature | Icon | Use |
| Filter |  | Used to filter the lineage. |
| Reload Graph |  | Assists in reloading graphs. |
| Manage Graph |  | To view and manage lineage by adding, modifying, or deleting nodes and their relationships to accurately reflect dependency structures. |
| Save |  | Used to save the lineage. |
| Download |  | Used to download the file. |
| Expand |  | Used to enlarge the screen. |
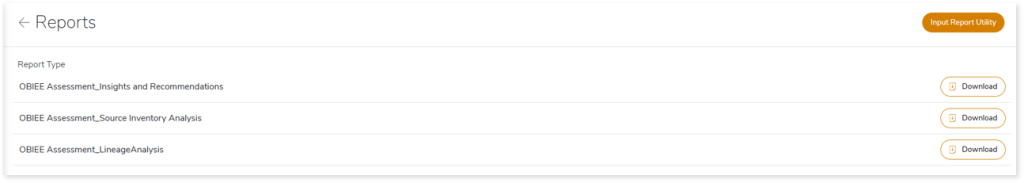
Downloadable Reports
Downloadable reports allow you to export detailed OBIEE assessment reports of your source data which enables you to gain in-depth insights with ease. To access these assessment reports, click Reports.

Types of Reports
In the Reports section, you can see various types of reports such as Insights and Recommendations, Source Inventory Analysis, and Lineage Analysis. Each report type offers detailed information allowing you to explore your assessment results.
Insights and Recommendations
This report provides an in-depth insight into the source input files. It contains the final output including the details of reports, presentation tables, logical tables, physical tables, and more.
Here, you can see the obiee folder along with obiee_report.xlsx report.
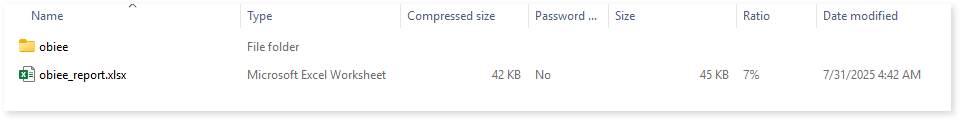
Obiee_report.xlsx: This report provides insights about the source inventory. It helps you plan the next frontier of a modern data platform methodically. It includes information about dashboards, dashboard pages, subject areas, and more.
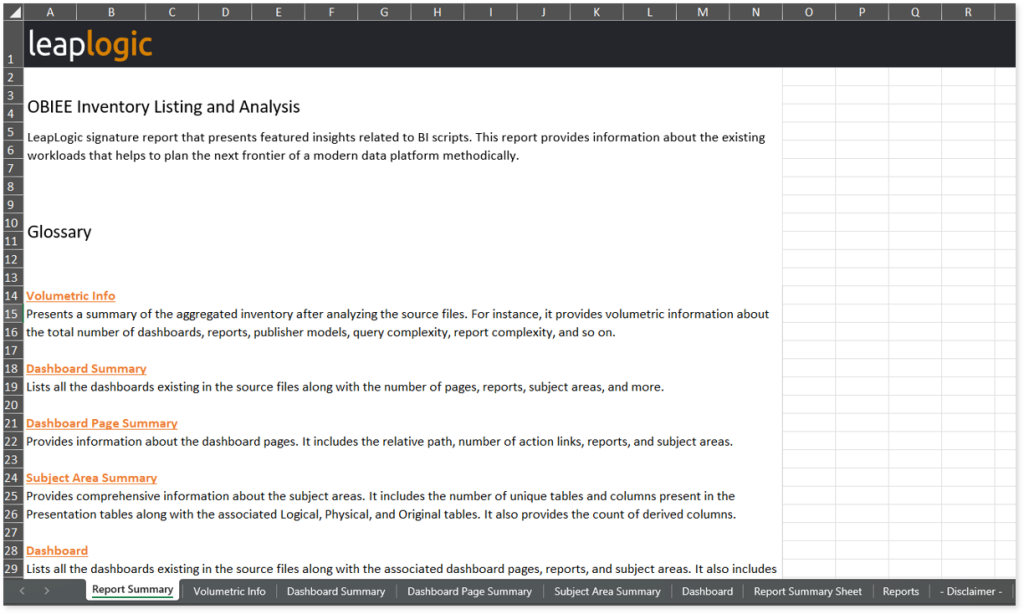
This report contains the following information:
- Report Summary: Provides information about all the generated artifacts.
- Volumetric Info: Presents a summary of the aggregated inventory after analyzing the source files. For instance, it provides volumetric information about the total number of dashboards, reports, publisher models, query complexity, report complexity, and so on.
- Dashboard Summary: Lists all the dashboards existing in the source files along with the number of pages, reports, subject areas, and more.
- Dashboard Page Summary: Provides information about the dashboard pages. It includes the relative path, number of action links, reports, and subject areas.
- Subject Area Summary: Provides comprehensive information about the subject areas. It includes the number of unique tables and columns present in the Presentation tables along with the associated Logical, Physical, and Original tables. It also provides the count of derived columns.
- Dashboard: Lists all the dashboards existing in the source files along with the associated dashboard pages, reports, and subject areas. It also includes the usage status of dashboard pages. If the status is False, it provides the reason for failure along with the dashboard and dashboard page paths.
- Report Summary Sheet: Provides comprehensive information about reports, including number of presentation tables, presentation columns, filters, complexity, and more.
- Reports: Lists all the reports along with information about subject areas, presentation tables, physical tables, status of the reports, and a lot more.
Browse through obiee folder to access reports such as obiee_dashboard_report_v2.csv, obiee_query_details_v2.csv, obiee_report_summary_v2.csv, Obiee_table_details.xlsx, and a lot more.
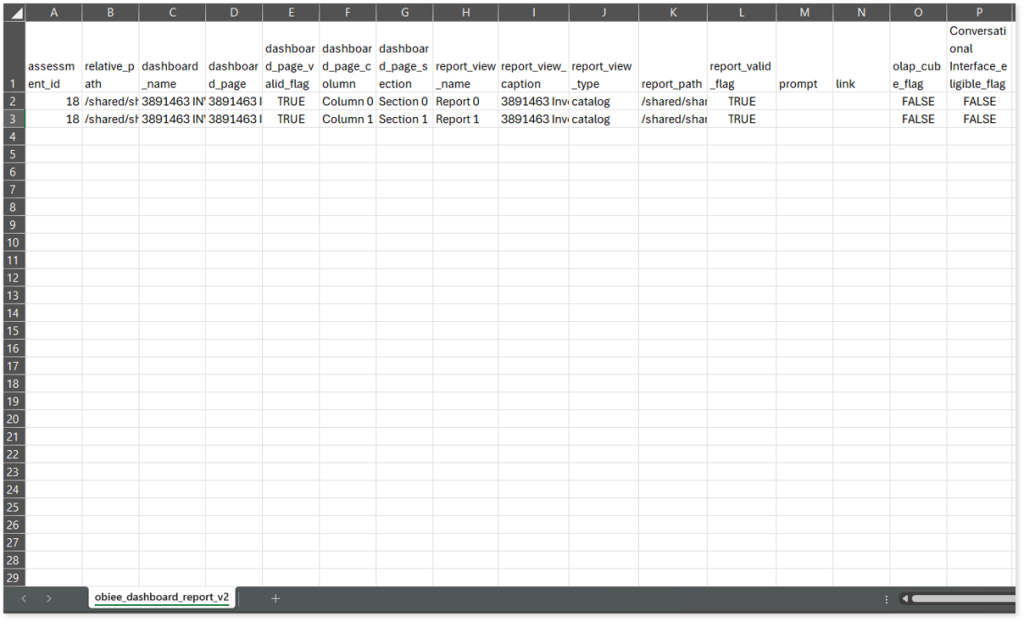
obiee_dashboard_report_v2.csv: This report contains information about OBIEE dashboards including dashboard pages, report views, prompts, and more.
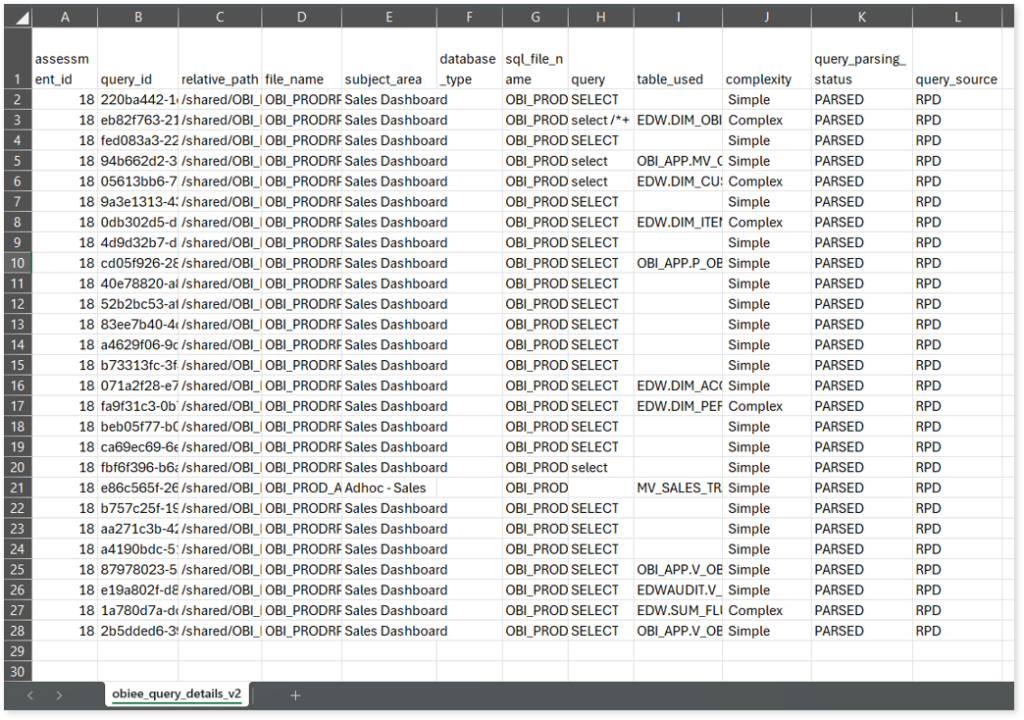
obiee_query_details_v2.csv: This report provides information about queries including subject areas, database types, tables used, query complexity, and more.
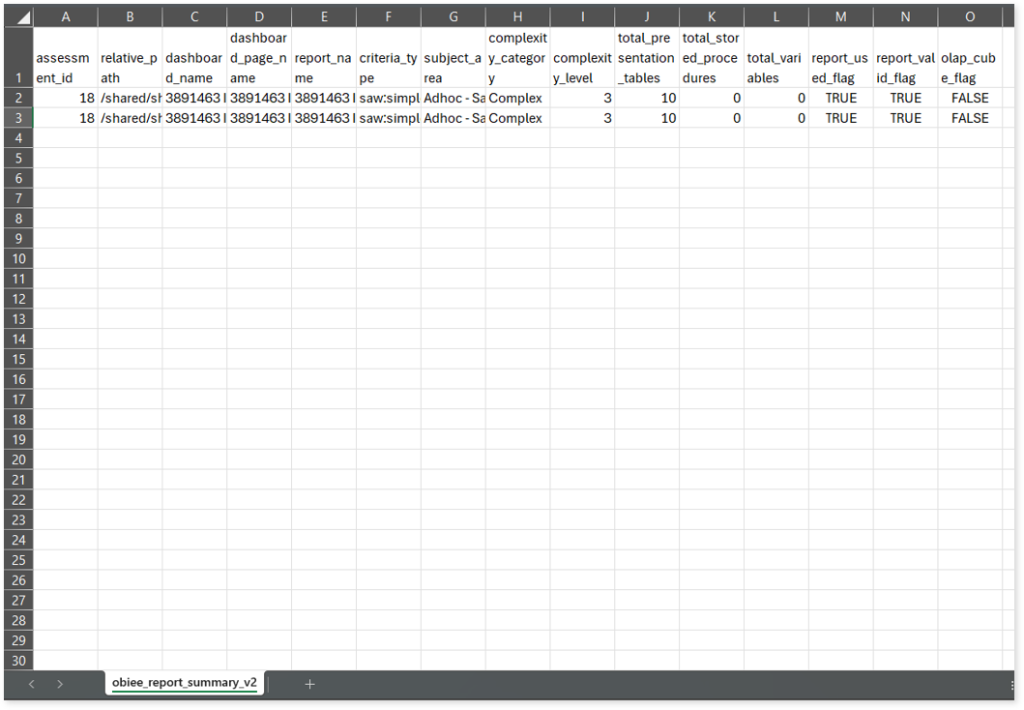
obiee_report_summary_v2.csv: This report provides a summary of the inventory after analyzing the source files. It includes information about dashboards, dashboard pages, reports, subject areas, complexity, and more.
Obiee_table_details.xlsx: This report contains information about OBIEE tables including presentation tables, physical tables, logical tables, and more.
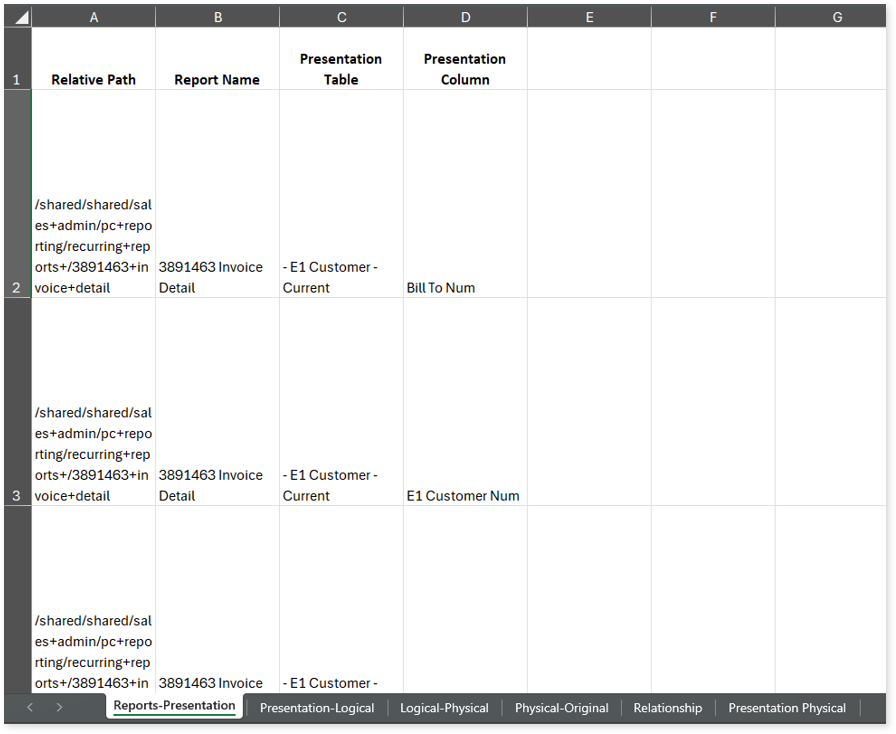
This report contains the following information:
- Reports-Presentation: Provides information about reports along with the associated presentation tables and columns.
- Presentation-Logical: Provides information about presentation tables along with the associated columns, business models, logical tables, and logical columns.
- Logical-Physical: Provides information about logical tables along with the associated columns, logical expressions, physical tables, and more.
- Physical-Original: Provides information about physical tables along with the associated columns, databases, schemas, original tables, and more.
- Relationship: Provides information about the relationship between two tables along with join types, join expressions, cardinality, and more.
- Presentation Physical: Provides information about presentation tables along with the associated columns, business models, logical tables, physical tables, and more.
Source Inventory Analysis
It is an intermediate report which helps to debug failures or calculate the final report. It includes all the generated CSV reports. This folder contains a bi folder along with the keywordSearch.csv and Lineage_Raw.xlsx reports.
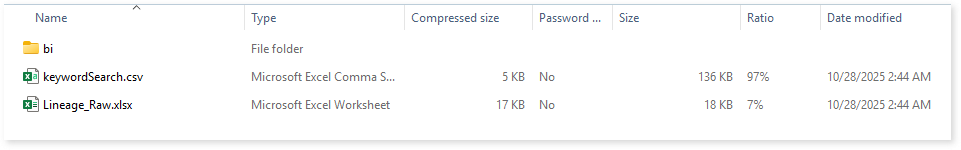
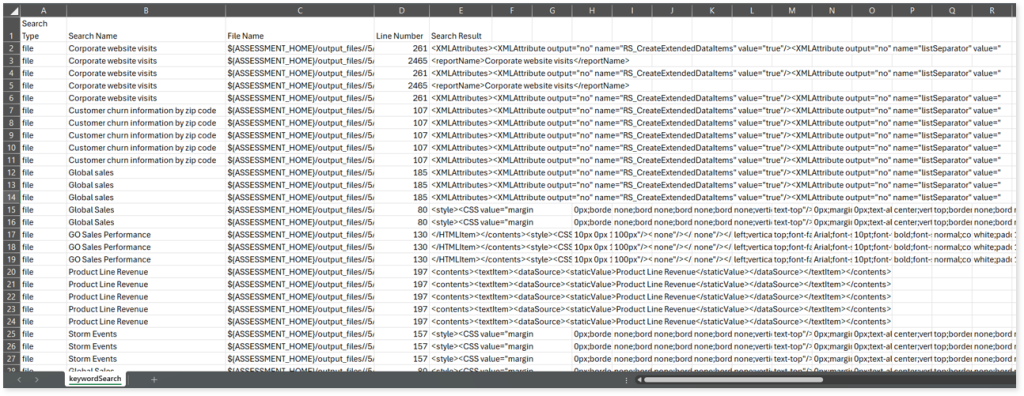
keywordSearch.csv: This report provides information about all the identified files using the file keyword search across uploaded source files. It includes details such as the search type, the file that contains the search keyword, the line number where it occurs, and other related information for each keyword.
This report helps to identify where specific file names appear across the uploaded source files. The system searches for each file name across all other uploaded source files, excluding the same file.
For example, if there are three files—File 1, File 2, and File 3—the system searches for occurrences of File 1 only in File 2 and File 3, excluding File 1 itself.
Lineage_Raw.xlsx: This report provides complete dependency details for all nodes. It provides an end-to-end data and process lineage that helps to identify the complete dependency structure and the data flow.
This report contains the following information:
- Volumetric Info: Provides volumetric information about the artifact types such as tables, presentation tables, dashboards, logical tables, database tables, physical tables, and reports.
- Nodes: Lists all the source and target nodes along with their type.
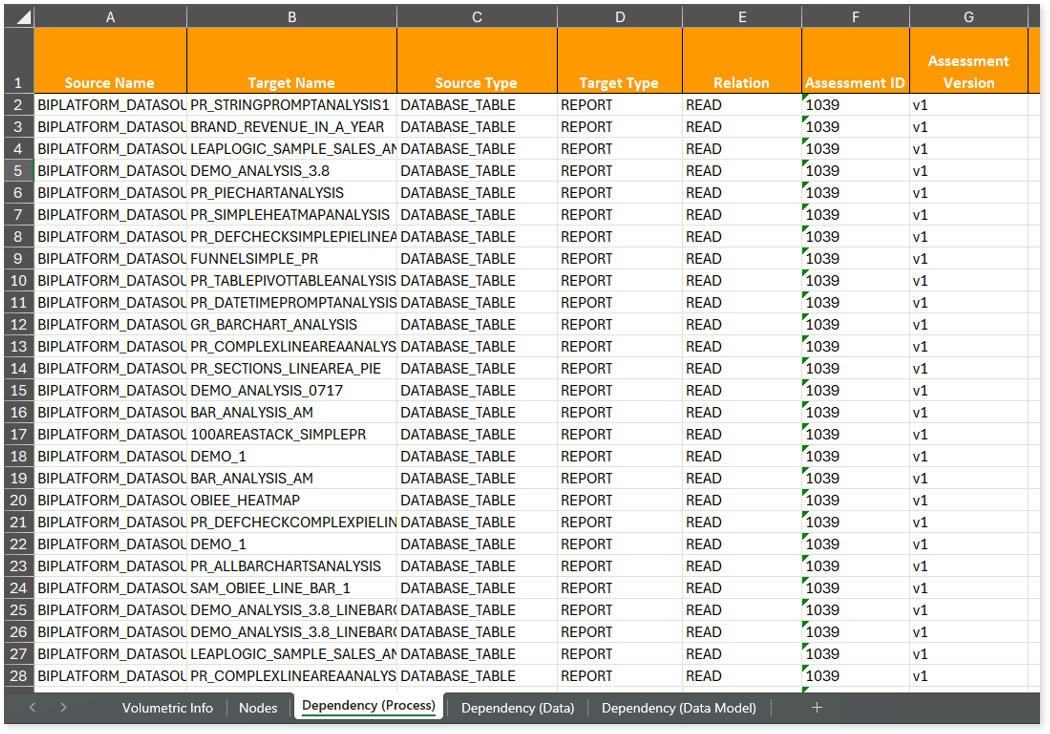
- Dependency (Process): Provides information about the process lineage.
- Dependency (Data): Provides information about the data lineage.
- Dependency (Data Model): Provides dependency details about the data models.
Browse through bi > obiee folders to access all the generated CSV reports, assessment_unparsed_files.csv, license_quota_info.csv, Obiee Hierarchy Report.xlsx, Obiee_table_details.xlsx, and more.
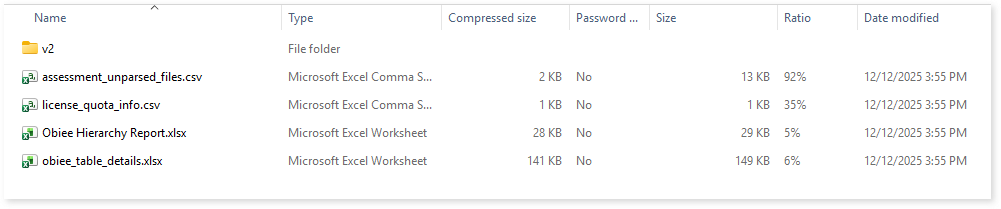
assessment_unparsed_files.csv: This report lists all the unparsed files along with the reason for parsing failure.
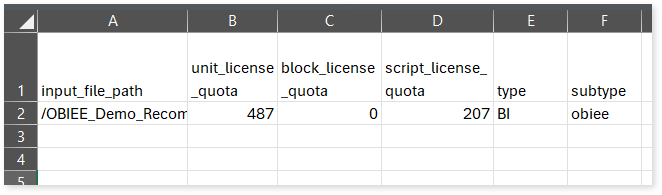
license_quota_info.csv: This report provides information about the anticipated license quota deduction when executing a transformation pipeline or notebook using the same source input file that was used during the assessment. It includes details about the expected quota consumption for units, blocks, and scripts.
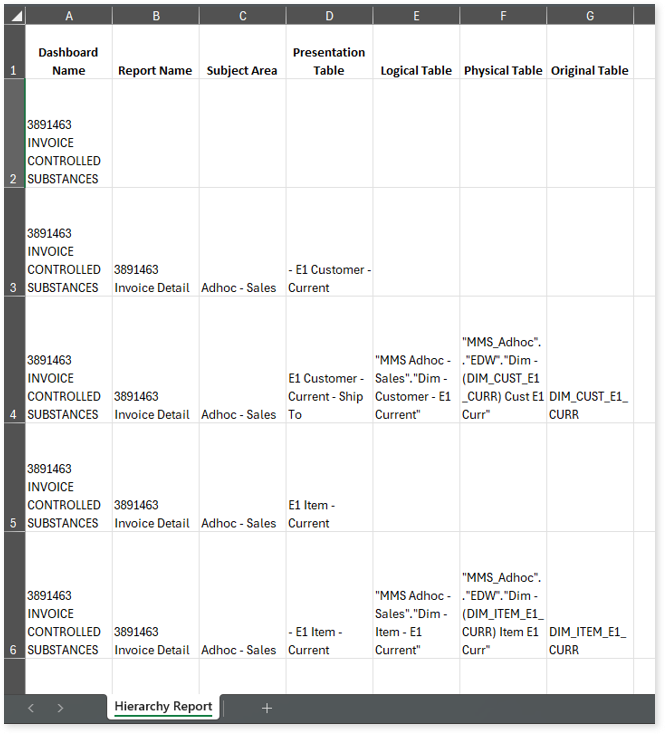
Obiee Hierarchy Report.xlsx: This report provides information about the hierarchy of OBIEE reports.
Obiee_table_details.xlsx: This report contains information about OBIEE tables including presentation tables, physical tables, logical tables, and more.
Lineage Analysis
This section provides lineage-related reports, including entity_link.csv, entity_report.csv, entity_summary.csv, link.csv, script_report.csv reports.
entity_links.csv: This report provides information about how views are connected to entities or tables and how these links extend across multiple levels. Level 1 shows the immediate table to which a view is linked. If that table is further connected to another entity, the next connection appears in Level 2, and so on.
entity_report.csv: This report provides detailed lineage information for each entity within the uploaded source files. It provides a comprehensive list of all entities along with their respective types, identifies the processes, entities, or scripts that read from or write to each entity, and includes other dependency details.
entity_summary.csv: This report provides a list of entities from uploaded source files, indicating where they appear (e.g., database tables, reports) and the operations performed on them—Read, Write, or ReadWrite.
link.csv: This report provides information about entities linked to each view.
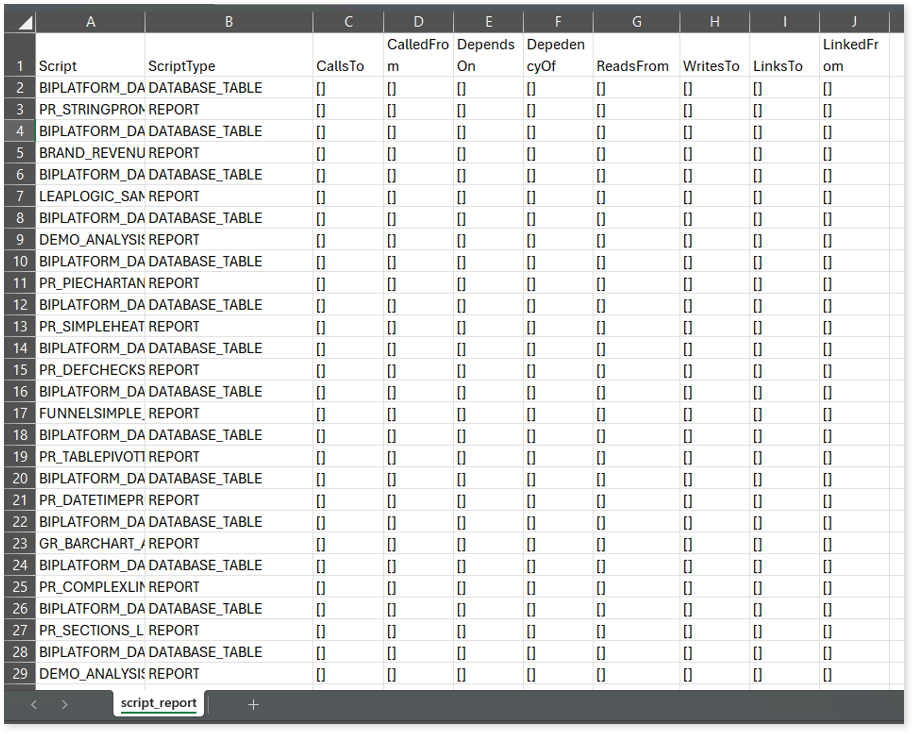
script_report.csv: This report provides detailed lineage information for each script. It lists all scripts along with their type, specifies the processes, entities, or scripts from which each script reads data and those to which it writes, as well as other dependency details.