Informatica Conversion Report
This topic provides a comprehensive report on the Informatica ETL conversion.
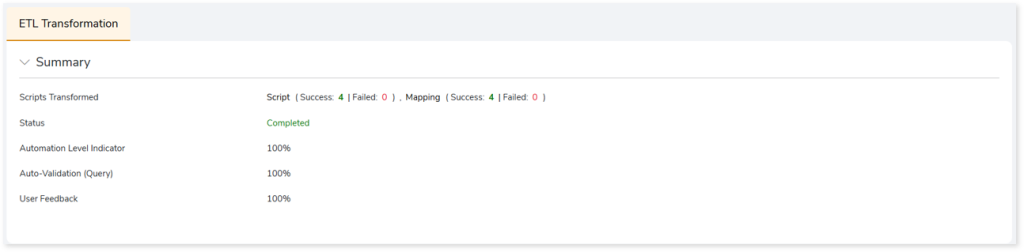
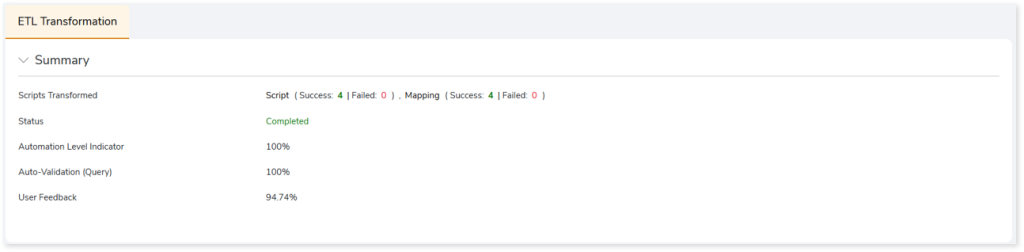
This section provides an overview of the ETL conversion, which includes:
- Scripts Transformed: Displays the number of scripts successfully converted and the number of scripts that are not. It also includes the number of scripts successfully mapped to the target and the number of scripts that are not mapped.
- Status: Status of the ETL Conversion stage.
- Automation Level Indicator: Displays the automation conversion coverage.
- Auto-Validation (Query): Displays the percentage of queries that have undergone syntax validation successfully.
- User Feedback: Displays the auto conversion percentage based on your feedback.
In this Topic:
Scripts
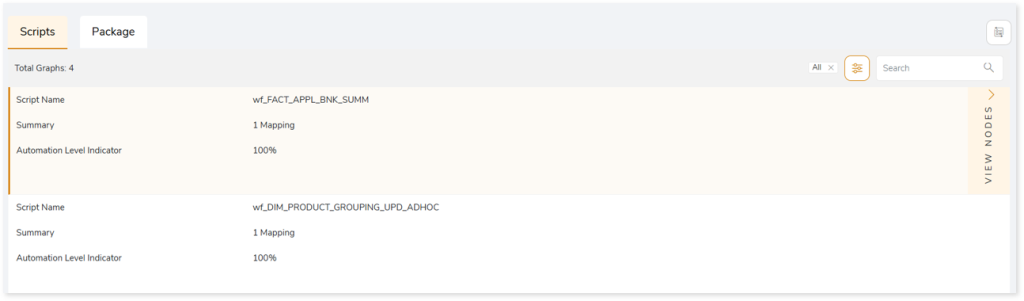
This topic shows a comprehensive report of the converted artifacts. It includes the name of the script, mapping summary, and file-wise auto-conversion percentage.
Browse through each script to get more insights into the transformations. In each transformation, you can see information about its status, type, auto-conversion percentage, and more. In addition, if you perceive that a successfully converted stage is inaccurate, then you can provide feedback and mark it as incorrect.
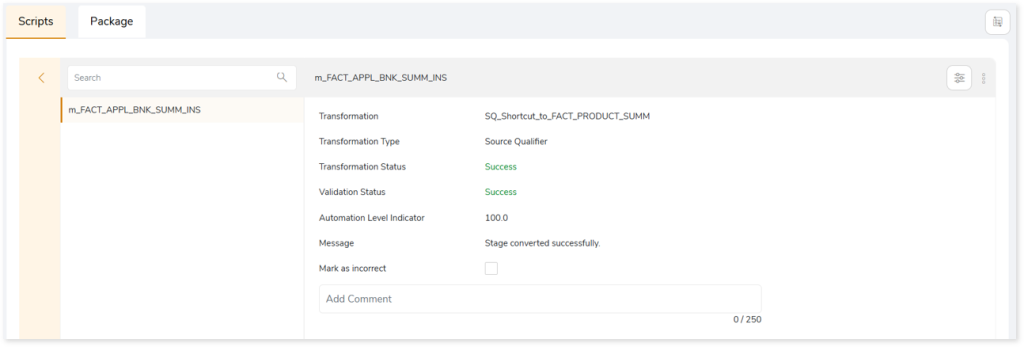
Click Mark as incorrect to indicate that the converted stage is incorrect. Additionally, you can provide detailed comments in the Add Comment field to explain the specific issues or discrepancies you have observed. After providing your constructive feedback, click  to recalculate the conversion automation based on your feedback. This ensures that the converted stage aligns more closely with the intended requirements or desired outcomes.
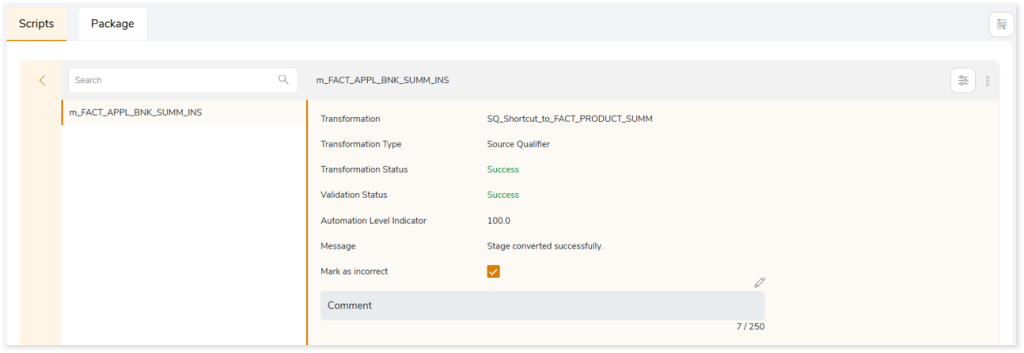
After clicking (Recalculate), you can see the updated conversion automation (User Feedback) based on your feedback in the Summary section.
Besides providing this information, this section allows you to take a variety of actions, such as:
|
Feature |
Icon |
Description |
|
Download All |
 |
To download all the graphs.
You can download graphs in an alternative way by:
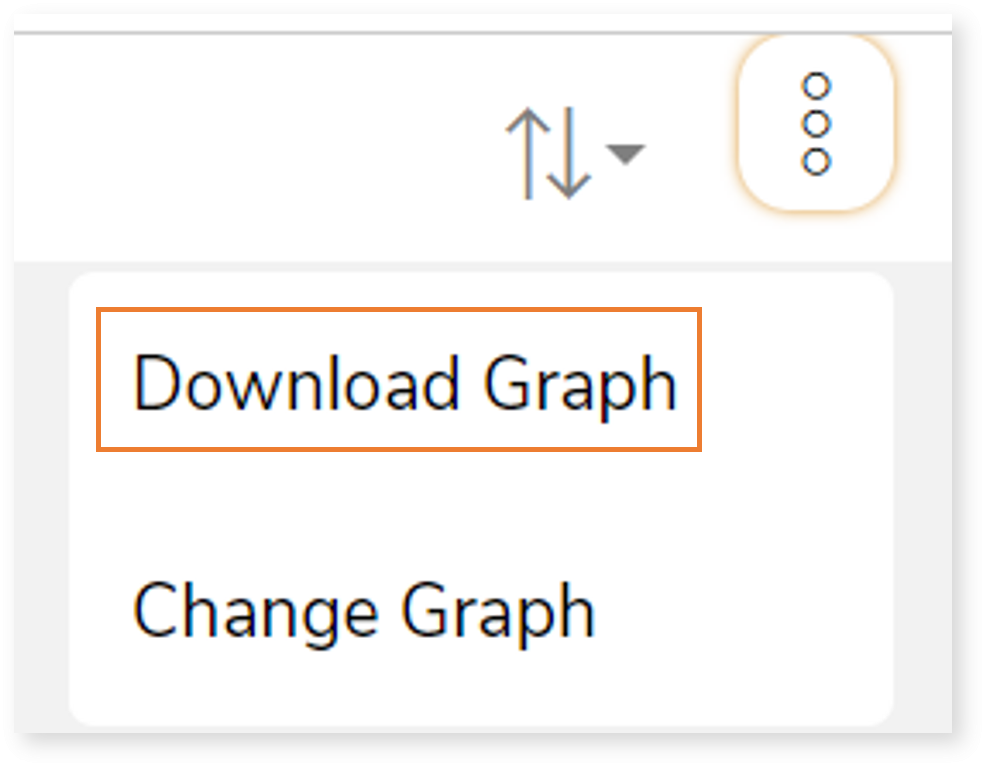
- Click
 on the preferred graph or node. on the preferred graph or node.
- Click
 and then select Download Graph. and then select Download Graph.
|
|
Upload |
 |
To upload a modified graph after making the required changes.
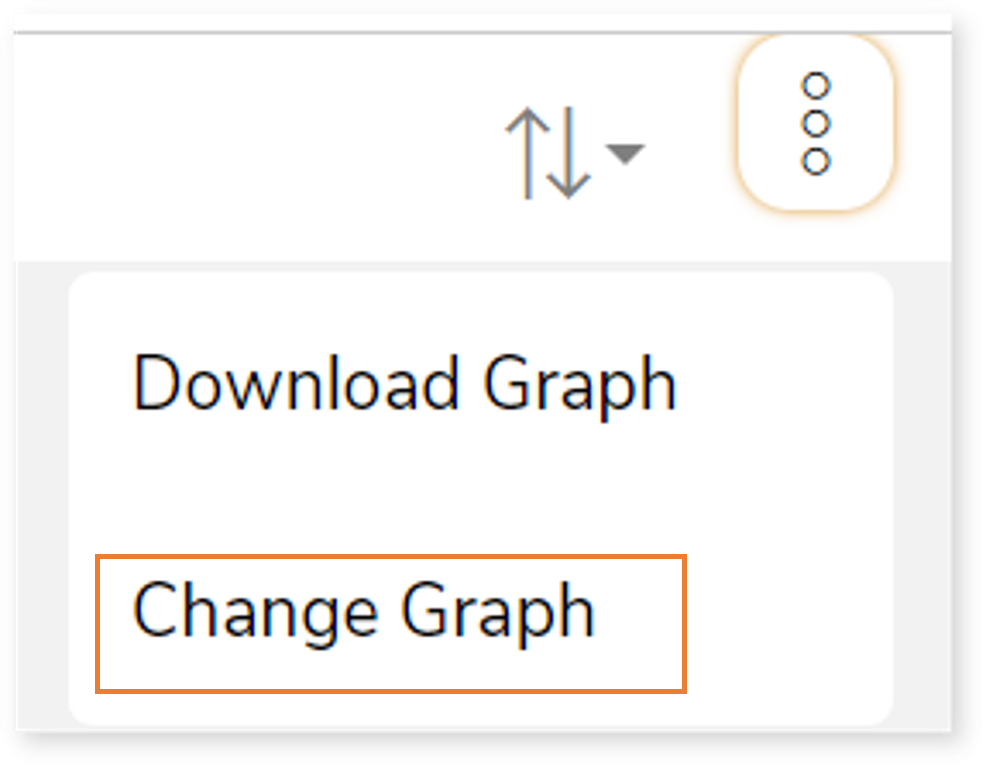
You can upload graphs in an alternative way by:
- Click on the preferred graph or node.
- Click and then select Change Graph.
|
|
Regenerate |
 |
To update and repackage the uploaded or changed graph.
If the artifacts are updated successfully, the system generates a snackbar popup to notify the success.  |
|
Sort |
 |
To sort the nodes. You can sort the nodes based on:
- All Nodes
- Success Nodes
- Failed Nodes
|
Package
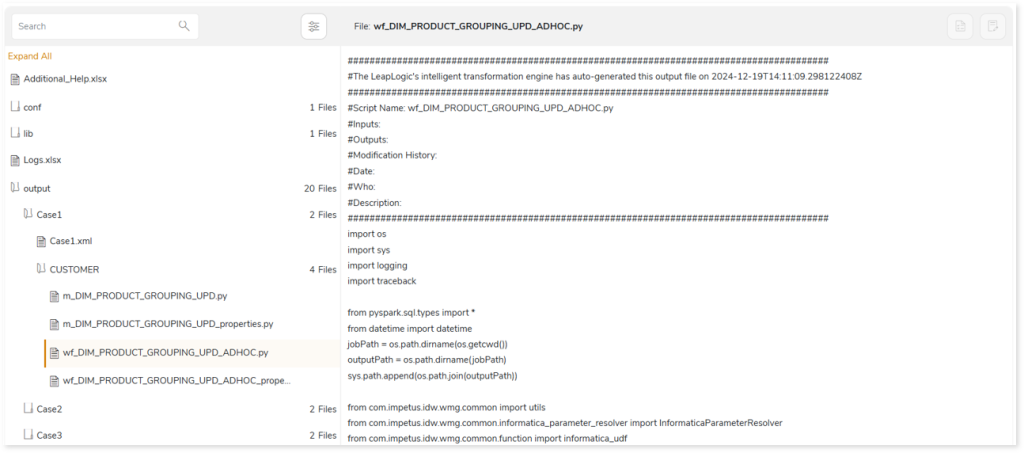
This topic provides a detailed report of the converted artifacts containing Python, sql, files, etc. which can be directly executed on the target platform.
To effectively transform your Informatica workloads to the target platform (AWS Glue Notebook, Delta Live Tables, Databricks, etc.) you need to enable common model.
To learn how to enable the common model, refer to Common Model.
Informatica ETL to AWS Glue Job
This section offers a detailed report on the conversion process from Informatica ETL to AWS Glue Job. Depending on the selected data interaction technique is:
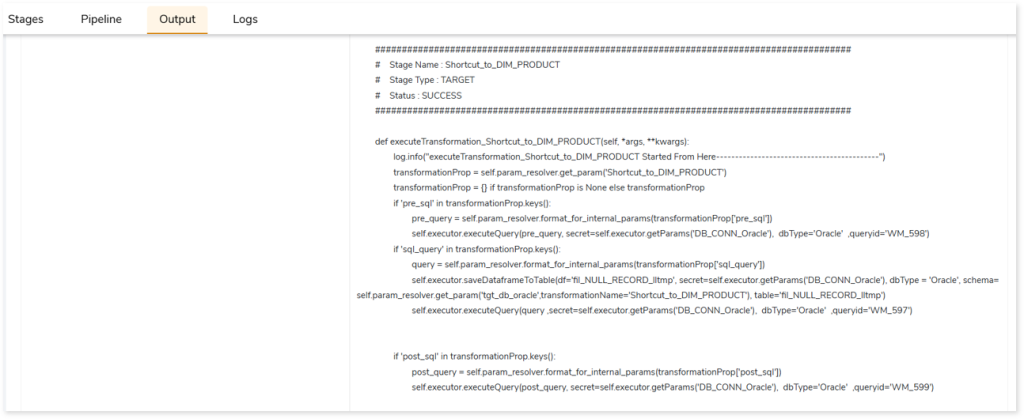
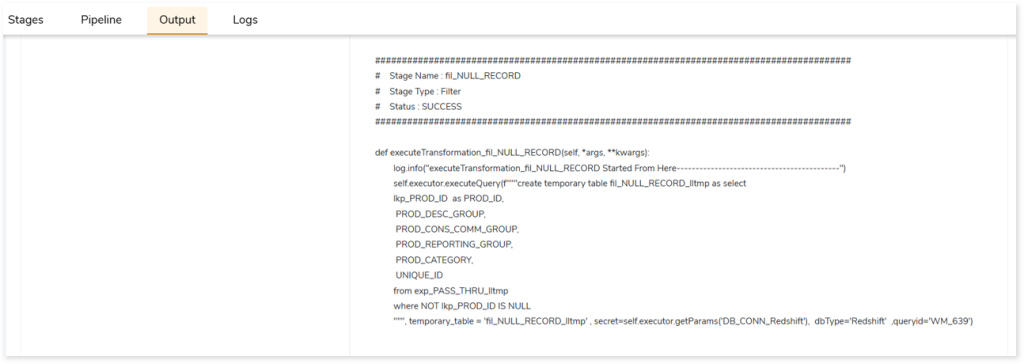
- Glue: Redshift: The legacy Informatica ETL workloads are transformed to target equivalent code which fetches input data from Amazon Redshift, processes it in Glue, and stores the processed or output data in Redshift. In the transformed artifacts, all the source queries are converted to Redshift whereas the intermediate tables are converted to Spark. The below image shows the transformed Redshift equivalent query.
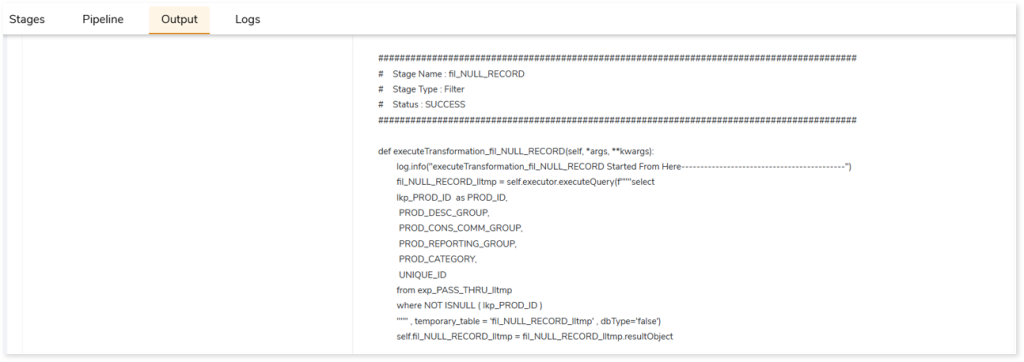
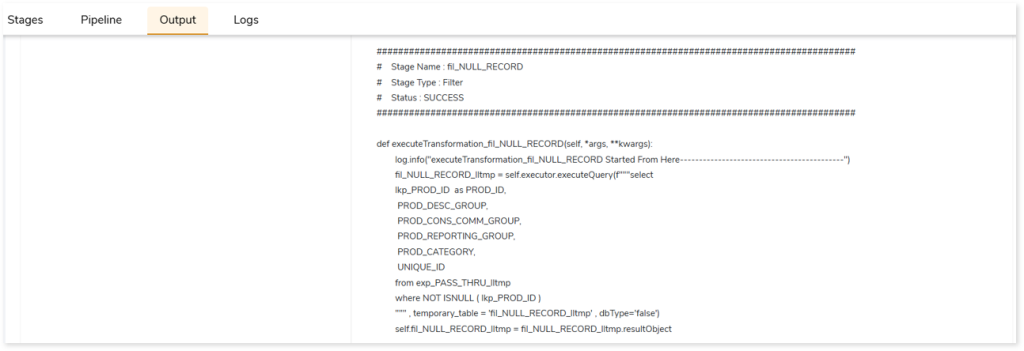
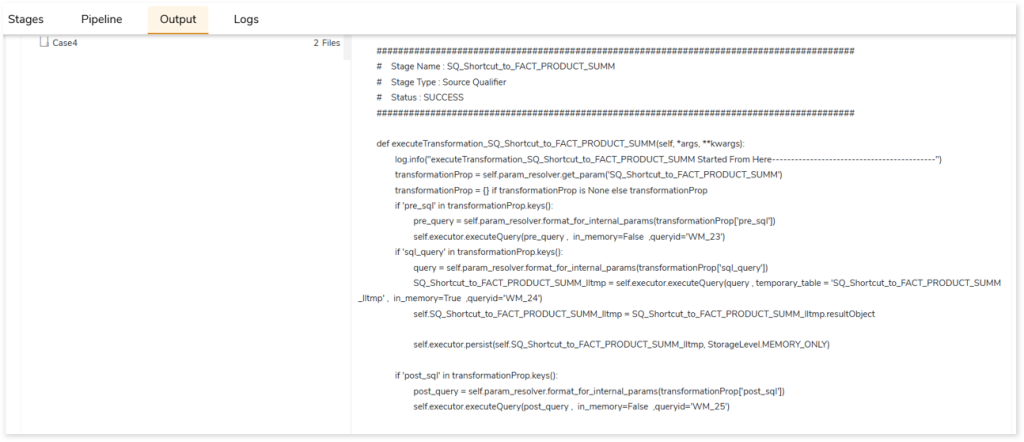
The image below showcases the transformed Spark equivalent code of the filter component. This code is utilized to create views, which can subsequently be leveraged in other components within the mapping.
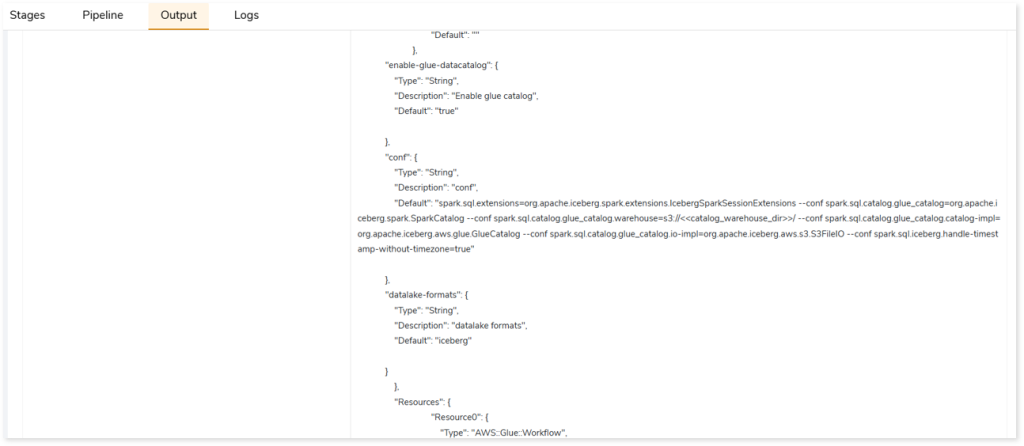
- Glue: Data Catalog: The legacy Informatica ETL workloads are transformed to target equivalent code which accesses data through the data catalog, processes data in Glue, and stores the processed or output data in the data catalog.
- Glue: External: The legacy Informatica ETL workloads are transformed to target equivalent code which fetches input data from an external source such as Oracle, Netezza, Teradata, etc., processes that data in Glue, and then moves the processed or output data to an external target. For instance, the source input file contains data from Oracle, and then the data is processed in Glue, and finally, the processed or output data gets stored in Oracle.
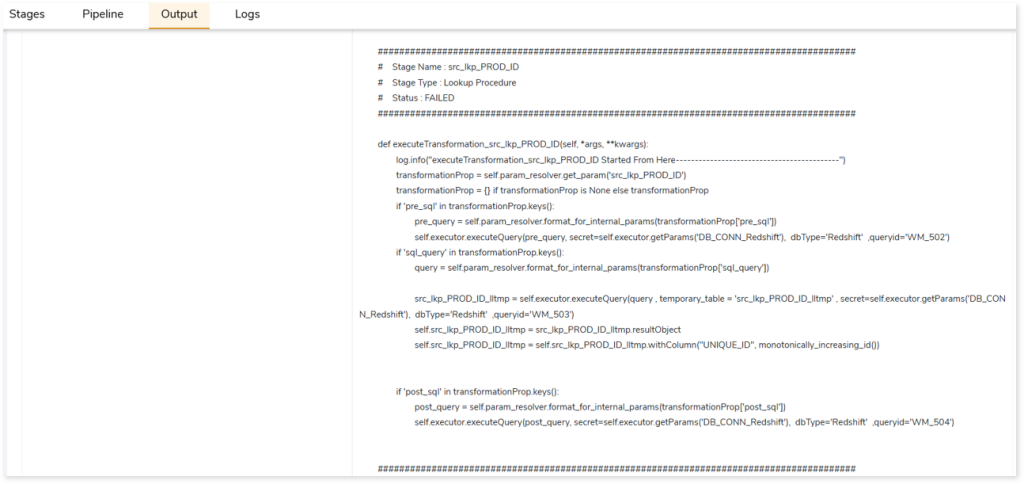
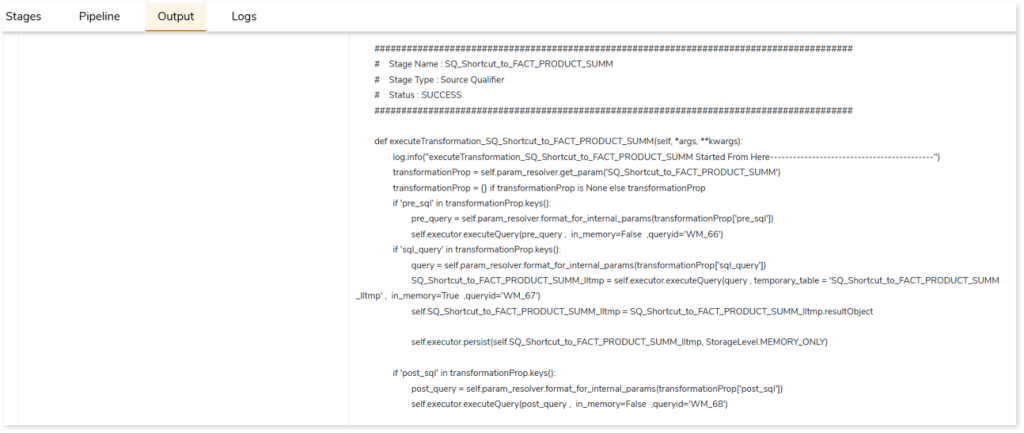
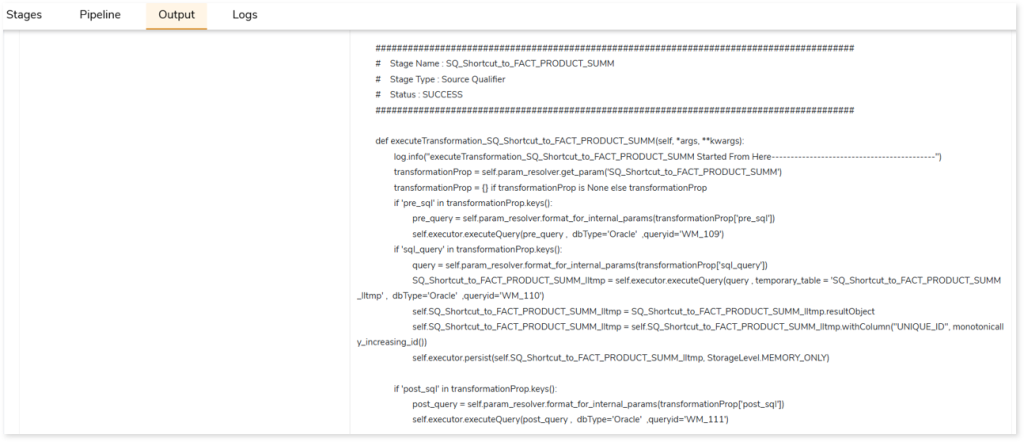
- Redshift ETL Orchestrated via Glue: The legacy Informatica ETL workloads are transformed to target equivalent code which accesses, processes, and executes data in Amazon Redshift and uses Glue for orchestration jobs. In the transformed artifacts, both source input and intermediate or temporary tables are converted to Redshift. In the below image, you can see the filter component that is converted to Redshift equivalent code.
- Glue: Hybrid: This interaction technique is a combination of different data interaction techniques (Glue: Redshift, Glue: Data Catalog, and Glue: External) it fetches and processes data from multiple data sources. It can take input from the data sources such as Redshift, Delta, Iceberg, RDS instances, or external sources, and processes it in Glue, and moves the output or processed data into the respective data sources. That is, using this technique you can convert source tables that resides on multiple data sources.
Informatica ETL to Databricks Lakehouse (Delta Live Tables)
This section offers a detailed report on the conversion process from Informatica ETL to Delta Live Tables. Depending on the selected data interaction technique,
- Databricks-Native: The legacy Informatica ETL workloads are transformed to target-equivalent code that fetches, processes, and stores data in Databricks Lakehouse.
- Databricks: Unity Catalog: The legacy Informatica ETL workloads are transformed to target-equivalent code that fetches, processes, and stores data within the Databricks Unity catalog.
- Databricks: External: The legacy Informatica ETL workloads are transformed to target-equivalent that fetches input data from an external source such as Oracle, Netezza, Teradata, etc., processes that data in Databricks, and then moves the processed or output data to an external target. For instance, the source input file contains data from Oracle, and then the data is processed in Glue, and finally, the processed or output data gets stored in Oracle.
Let us see the output of Informatica ETL to Delta Live Tables conversion using DLT Meta (common model) enabled. The DLT Meta facilitates the creation of a bronze table within the Databricks Lakehouse. So, rather than fetching data directly from the source such as flat files, it creates a bronze table (replica of the file) within Databricks. As a result, instead of reading data from the file, it directly fetches data from the table.
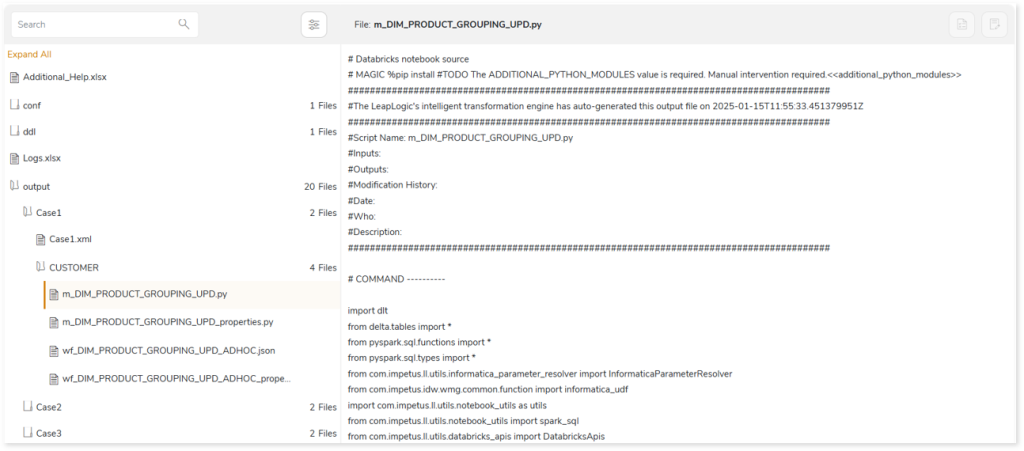
Here, in addition to the output package, you can see conf (Onboarding.json file) and ddl folders, where:
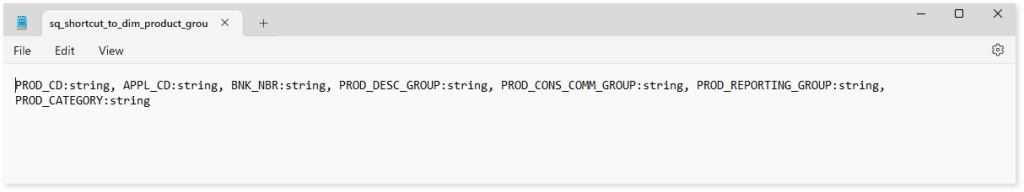
- ddl: ddl contains the schema information to generate bronze table from the flat file. These flat files are delimited files where the field separator such as comma, colon, etc., delimits the information across the columns in the input file. So, providing the schema structure is essential for creating a table.
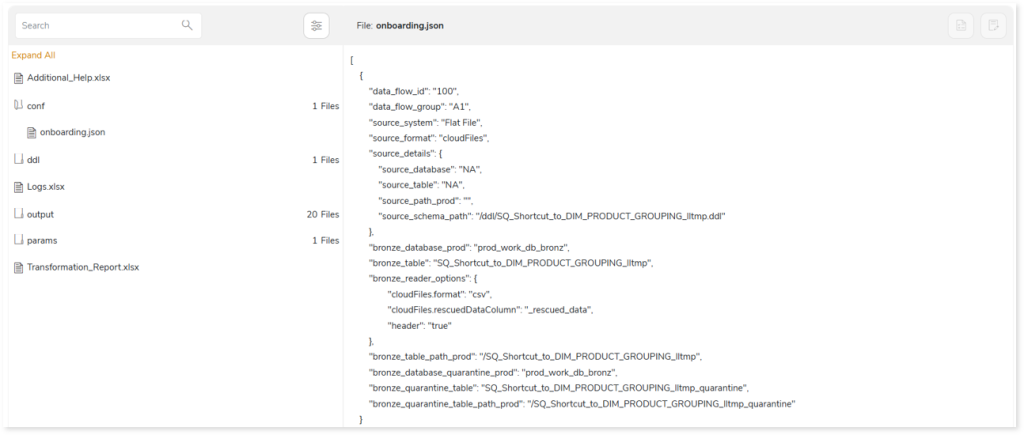
- Onboarding.json: Onboarding.json contains information about all the bronze tables including source schema path, output path, and other relevant details. Based on this information, bronze table will be created in Databricks.
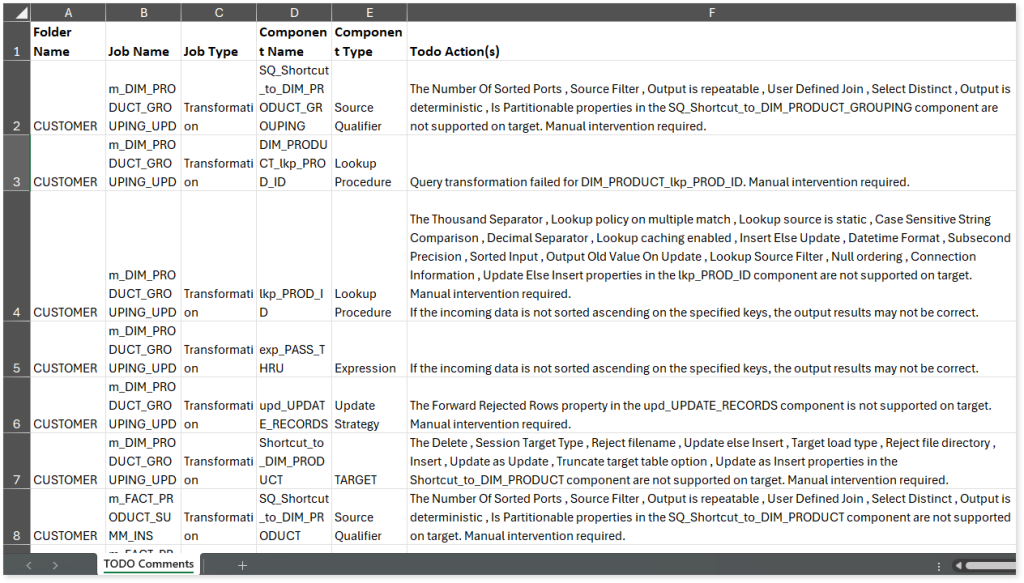
In Addition, the TODO_Report file displays messages regarding all unsupported components or queries that cannot auto-convert and require manual intervention.
In the Package section, you can also see Transformation_Report.xlsx file which contains a comprehensive report of the transformation, queries, and the associated deductible license quota. License quota is deducted for units when converting Informatica workloads to target equivalents, where unit refers to transformation. The license deduction logic is determined based on:
- File Similarity: The platform employs a similarity evaluation framework that determines the relative correspondence of an incoming file against a corpus of previously processed artifacts. This evaluation yields a similarity index which, in turn, is reconciled with internally governed threshold parameters. The interaction between these values serves as the basis for deciding whether an adjustment to the license quota becomes applicable. In certain conditions—when the index exhibits sufficient divergence or proximity to the threshold—quota units may be appropriated, while under alternative conditions, no adjustment is applied. Accordingly, files demonstrating pronounced affinity to earlier executions may, under some circumstances, bypass incremental quota attribution, whereas those exhibiting less congruence may result in measurable deductions. The precise determination is mediated by proprietary system logic, operating on layered interpretations of similarity scores.
- Complexity: Beyond similarity considerations, the dimensional aspect of unit-level complexity exerts a significant influence on how quota utilization is ultimately reconciled. Each transformation embedded within a workflow undergoes an internalized evaluation process, wherein its relative intricacy is algorithmically weighted. The categories conventionally denoted as Simple, Medium, and Complex are best regarded as heuristic markers rather than rigid determinants, serving to indicate how the platform apportions value within the broader license framework. Quota adjustments therefore emerge not as a straightforward arithmetic application but as the aggregated outcome of weighted interpretations distributed across all constituent units. As a result, even workflows of ostensibly comparable scale may reflect markedly different quota implications, contingent upon how the system adjudicates and interprets the relative complexity of their internal transformations. In effect, the quota impact is shaped less by file size alone than by the nuanced interplay of classification, weighting, and systemic evaluation.
- Automation Level Indicator: Automation Level Indicator refers to the extent to which files are automatically converted from source to the target equivalent. Higher automation level indicator value indicates that most of the file is automatically converted and requires less manual intervention. The license quota deduction depends on whether the automation level indicator meets or exceeds the predefined threshold value.
- Number of Successfully Transformed ETL Scripts: This is one of the criteria used for license quota deduction, where the deduction depends on the number of successfully transformed ETL Scripts.
You can see the Transformation_Report.xlsx report below.
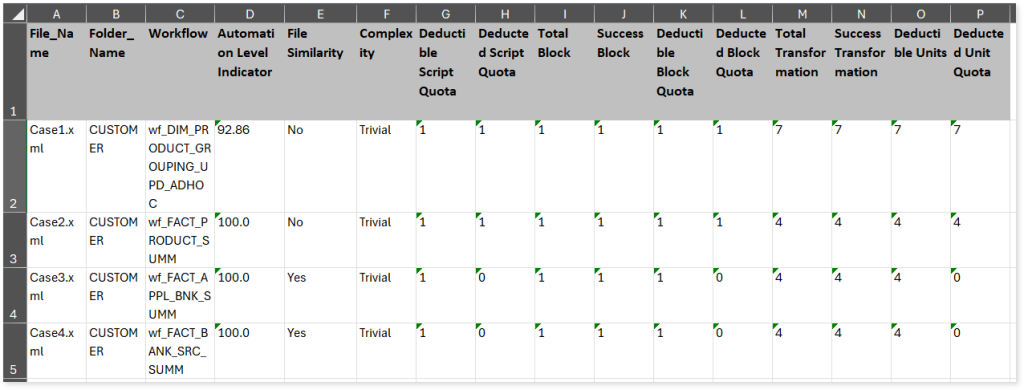
The Summary sheet (refer the above image) in Transformation_Report.xlsx file showcases detailed information about the license deductible quota.
- File Name: Displays the name of the file.
- Folder Name: Displays the name of the folder.
- Workflow: Displays the name of the workflow.
- Automation Level Indicator: Displays the auto-conversion percentage of each workflow.
- File Similarity: Indicates whether the file is similar to the already executed file. If the value is Yes, then the file is similar to an already executed file else No.
- Complexity: Displays the complexity of each workflow.
- Total Transformation: Displays the number of total transformations.
- Success Transformation: Displays the number of successfully transformed transformations.
- Deductible Units: Displays the unit quota that needs to be deducted based on the complexity checks and balances.
- Deducted Unit Quota: Displays the actual unit quota deducted.
The Query sheet provides information about all queries along with its conversion status, transformation engine, validation status, and more.
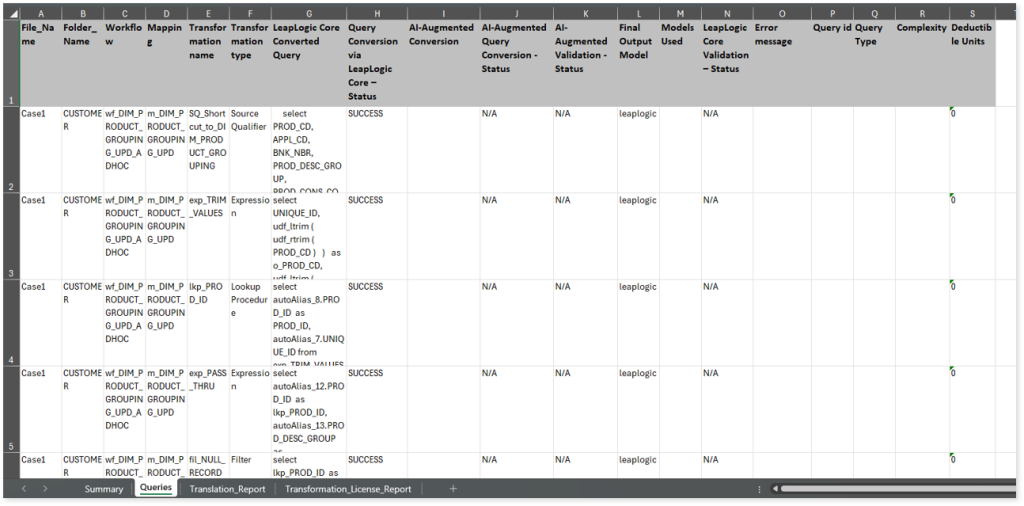
- File Name: Displays the name of the file.
- Folder_Name: Displays the name of the folder.
- Workflow: Displays the name of the workflow.
- Mappings: Displays the associated mappings.
- Transformation name: Displays the name of the transformation.
- Transformation type: Displays the type of transformation.
- LeapLogic Core Converted Query: Displays the queries that are transformed by the LeapLogic Core engine.
- Query Conversion via LeapLogic Core – Status: Displays the conversion status of each query transformed by the LeapLogic Core engine. If the conversion status is SUCCESS, it signifies that the query has been successfully transformed to the target equivalent whereas the FAILED status indicates that the query is failed to transform.
- AI-Augmented Conversion: Displays the queries that are transformed by the LeapLogic AI models.
- AI-Augmented Query Conversion – Status: Displays the conversion status of each query transformed by the LeapLogic AI model. If the conversion status is SUCCESS, it signifies that the query has been successfully transformed to the target equivalent whereas the FAILED status indicates that the query is failed to transform.
- AI-Augmented Validation – Status: Displays the status of the syntax validation for queries converted by the LeapLogic AI models. If the status is SUCCESS, it indicates that the query passed syntax validation, FAILED indicates a validation failure, and N/A indicates that the syntax validation was not applied.
- Final Output Model: Displays the model used to generate the final transformed output.
- Models Used: Displays all the models used to transform each query. If the LeapLogic Core engine fails to convert a query to the target equivalent, then the system uses the LeapLogic AI models to convert the failed query.
- LeapLogic Core Validation – Status: Displays the status of the syntax validation for queries converted by the LeapLogic Core engine. If the status is SUCCESS, it indicates that the query passed syntax validation, FAILED indicates a validation failure, and N/A indicates that the syntax validation was not applied.
- Error message: Displays the reason for query validation failure.
- Query id: Displays the unique identifier for each query.
- Query Type: Displays the type of each query.
- Complexity: Displays the complexity of each query.
- Deductible Units: Displays the unit quota that needs to be deducted based on the complexity checks and balances.
The Translation_Report sheet in Transformation_Report.xlsx file provides a comprehensive report of the conversion. It includes information about workflows, mapplets, mappings, transformations, and more.
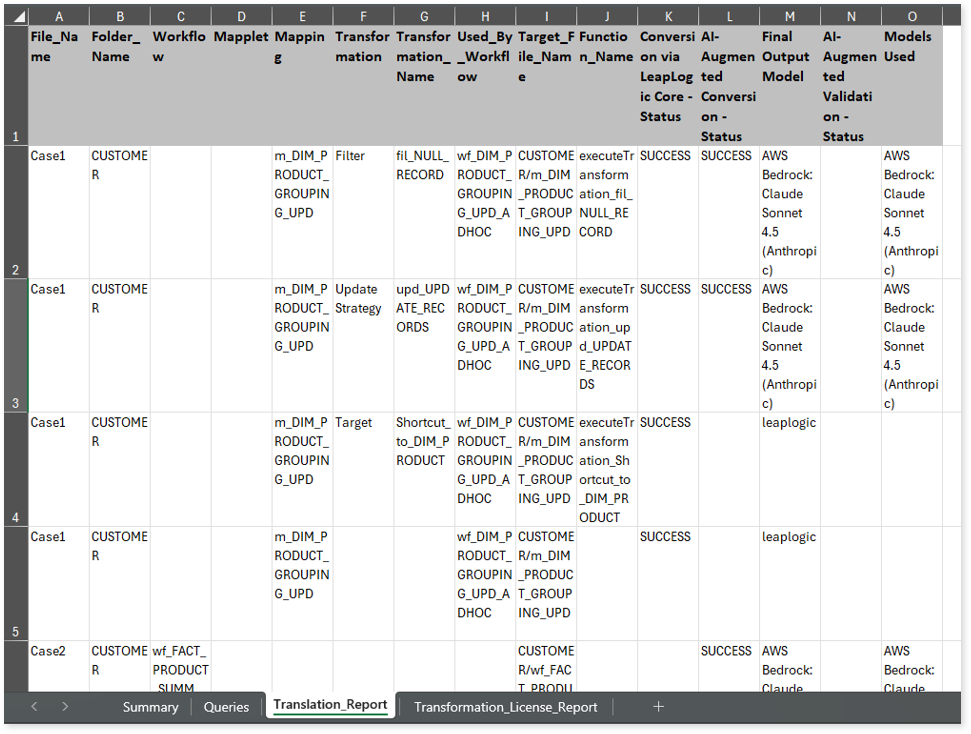
- File Name: Displays the name of the file.
- Folder_Name: Displays the name of the folder.
- Workflow: Displays the name of the workflow.
- Mapplet: Displays the name of the mapplet.
- Mappings: Displays the associated mappings.
- Transformation: Displays the associated transformation.
- Transformation_Name: Displays the name of the transformation.
- Used_By_Workflow: Displays the associated workflow.
- Target_File_Name: Displays the name of the target file.
- Function_Name: Displays the function associated with the transformation.
- Conversion via LeapLogic Core – Status: Displays the conversion status of each transformation converted by the LeapLogic Core engine. If the status is SUCCESS, it indicates that the transformation has been successfully transformed to the target equivalent, whereas FAIL indicates that the transformation failed to convert.
- AI-Augmented Conversion – Status: Displays the conversion status of each transformation converted by the LeapLogic AI model. If the status is SUCCESS, it indicates that the transformation has been successfully transformed to the target equivalent, whereas FAIL indicates that the transformation failed to convert.
- Final Output Model: Displays the model used to generate the final transformed output.
- AI-Augmented Validation – Status: Displays the status of the syntax validation for transformations converted by the LeapLogic AI models. If the status is SUCCESS, it indicates that the query passed syntax validation, FAILED indicates a validation failure, and N/A indicates that the syntax validation was not applied.
- Models Used: Displays all the models used to convert each transformation. If the LeapLogic Core engine fails to convert a transformation to the target equivalent, then the system uses the LeapLogic AI models to convert them.
The Transformation_License_Report sheet provides a comprehensive report of the conversion along with the unit quota deduction.
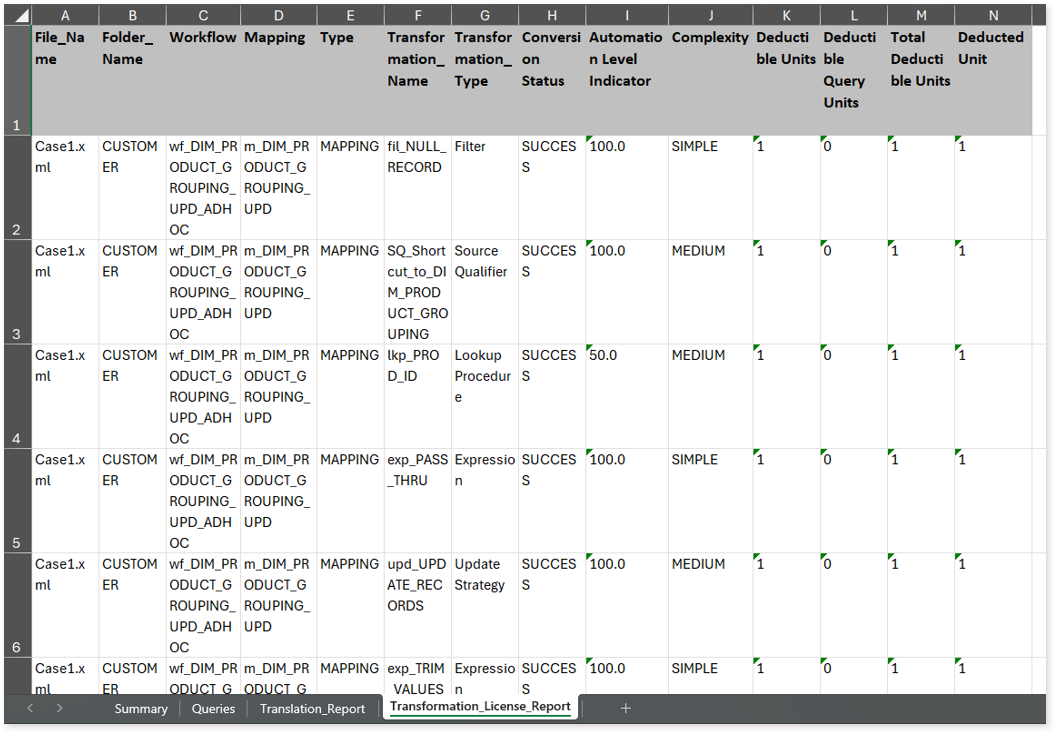
- File Name: Displays the name of the file.
- Folder_Name: Displays the name of the folder.
- Workflow: Displays the name of the workflow.
- Mappings: Displays the associated mappings.
- Type: Displays the type of each workflow.
- Transformation_Name: Displays the associated transformation.
- TRANSFORMATION_TYPE: Displays the type of the transformation.
- Conversion Status: Indicates the conversion status of each transformation. If the value is SUCCESS the transformation is converted successfully, else FAIL.
- Automation Level Indicator: Displays the automation conversion percentage of each transformation.
- Complexity: Displays the complexity of each transformation.
- Deductible Units: Displays the unit quota that needs to be deducted based on the complexity checks and balances.
- Deductible Query Units: Displays the EDW query units that need to be deducted based on the number of transformed queries.
- Total Deductible Units: Displays the total number of deductible unit quota and EDW query units.
- Deducted Unit: Displays the actual unit quota deducted.
When you try to convert units that exceed the available license quota, those within the quota will successfully convert. However, any additional units beyond the quota will fail to transform and display an error message indicating “License quota insufficient.”
You can apply: