Control-M Assessment Report
This topic contains information about the Control-M assessment report. Control-M is an automated job scheduling tool that controls scheduling, monitoring, and executing tasks. The input format for the Control-M assessment is XML.
In This Topic:
Highlights
The highlights section gives you a high-level overview of your assessment summary based on the analysis of the selected scheduler scripts. It includes a summary as well as orchestration details of the source input scripts.
Summary
This section provides an overview of input source files and the associated workload inventory including folders, sub folders, jobs, and more
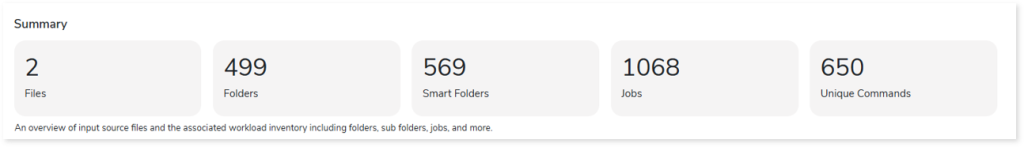
- Files: Displays the number of input source files.
- Folders: Displays the number of folders present in the input source files. Folders contains the related jobs.
- Smart Folders: Displays the number of smart folders present in the input source files. Smart folder offers advanced job scheduling capabilities, allowing the scheduling criteria to be defined at the folder level. Subsequently, all jobs in the smart folder inherit these defined criteria.
- Jobs: Displays the number of jobs present in the folders and smart folders. Jobs are scheduler scripts that run in a certain order to perform a set of activities.
- Unique Commands: Displays the number of unique commands.
Applications
This section provides an overview of total and sub-applications along with their distribution across application types.
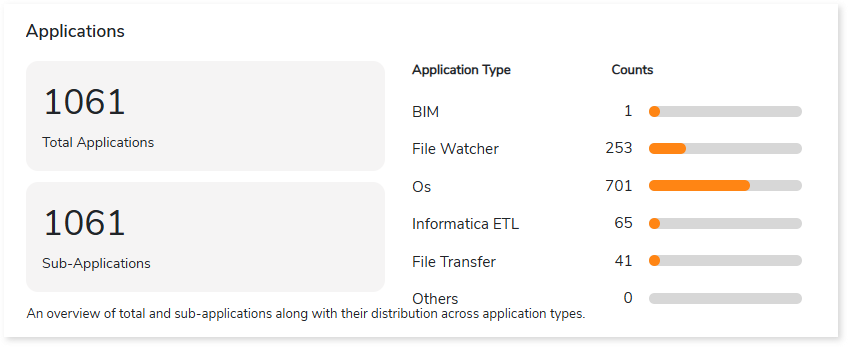
- Total Applications: Displays the total number of applications present in the input files.
- Sub-Applications: Displays the number of sub-applications present in the input files. Sub-applications categorize related jobs based on the specific requirements within the application.
- Application Type: Lists the application types along with the number of associated applications.
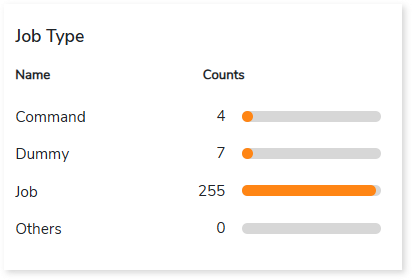
Job Type
This section provides information about various job types
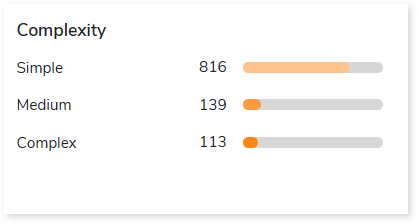
Complexity
This section provides a summarized graphical representation of the classification of Control-M jobs based on a detailed complexity assessment. This information is required to make different decisions, including migration planning, estimating budget, etc.
Schedules
This section provides an overview of schedules along with their frequency.
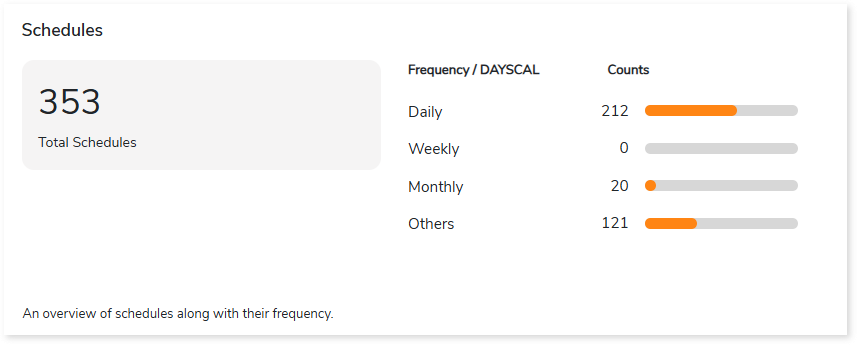
- Total Schedules: Displays the total number of schedules.
- Frequency: Displays the frequency of scheduled jobs such as daily, weekly, monthly, etc., along with the number of schedules.
Watch Files
An overview of watch files along with their distribution across watch file types.
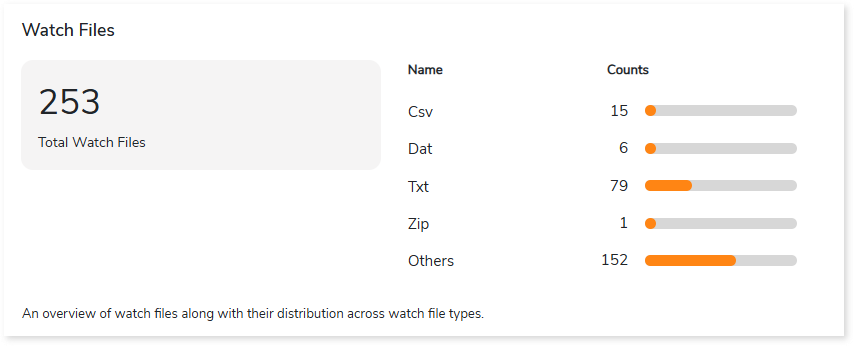
- Total Watch Files: Displays the total number of watch files.
- Name: Lists the watch file types such as Zip, TXT, CSV, etc., along with their count.
Analysis
This topic provides a detailed examination of jobs existing in the Control-M scripts.
Jobs
This section provides a complete analysis of the jobs. It lists all the jobs along with information about the jobs such as conditions, availability status, applications, and a lot more. Jobs are scheduler scripts that run in a certain order to perform a set of activities.
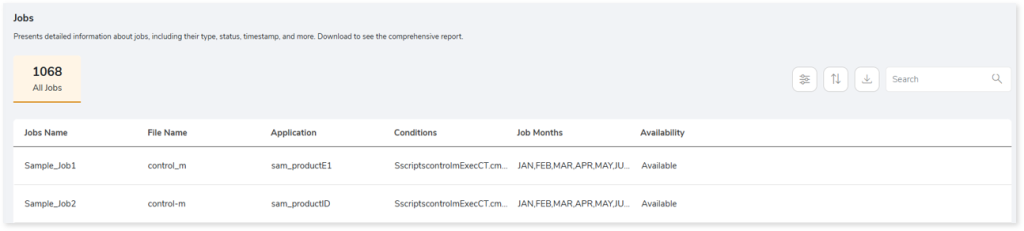
- Jobs Name: Displays the name of the jobs.
- File Name: Displays the name of the source script that is associated with each job.
- Application: Displays the applications defined within the jobs.
- Conditions: Displays the conditions that must be met for a job to run.
- Job Months: Displays the months in which the job is scheduled.
- Availability: Displays the availability of jobs.
- Available: Jobs that are available in both scripts and execution logs.
- Unavailable: Jobs that are available in scripts but not in execution logs.
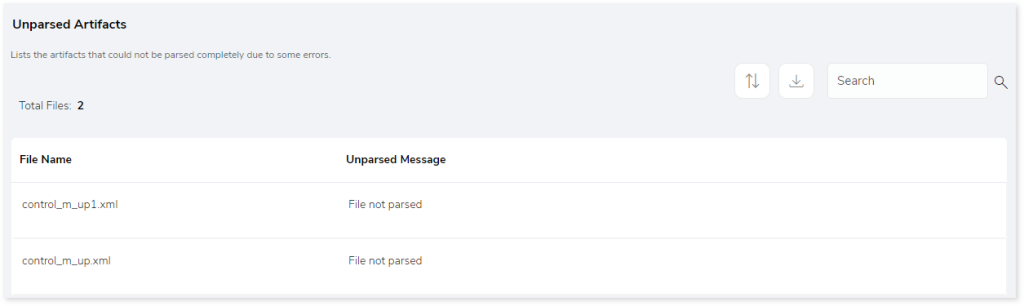
Artifacts
This section lists all the artifacts that could not be parsed completely due to some error.
Lineage
End-to-end data and process lineage identify the complete dependency structure through interactive and drill-down options to the last level.
Typically, even within one line of business, multiple data sources, entry points, ETL tools, and orchestration mechanisms exist. Decoding this complex data web and translating it into a simple visual flow can be extremely challenging during large-scale modernization programs. The visual lineage graph adds tremendous value and helps define the roadmap to the modern data architecture. It deep dives into all the existing flows, like Autosys jobs, applications, ETL scripts, BTEQ/Shell (KSH) scripts, procedures, input and output tables, and provides integrated insights. These insights help data teams make strategic decisions with greater accuracy and completeness. Enterprises can proactively leverage integrated analysis to mitigate the risks associated with migration and avoid business disruption.
Now, let’s see how you can efficiently manage lineage.
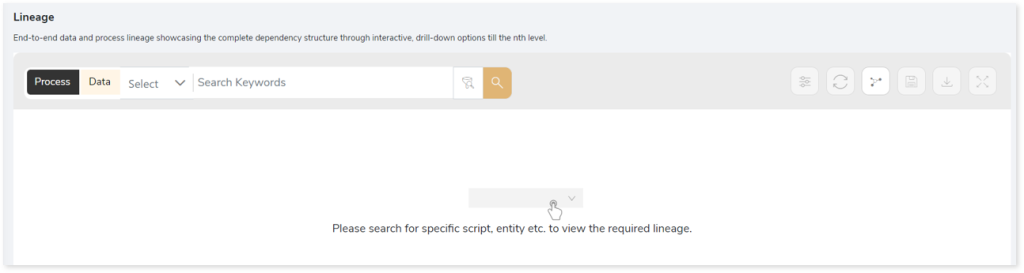
To view the required lineage:
- Select either the Process or Data tab.
- Enter the keywords in the Search Keywords field.
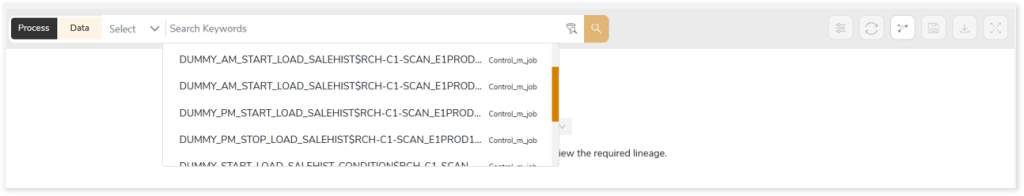
- Click the Search icon to generate the lineage.

Process lineage illustrates the dependencies between two or more processes such as files, jobs, etc.
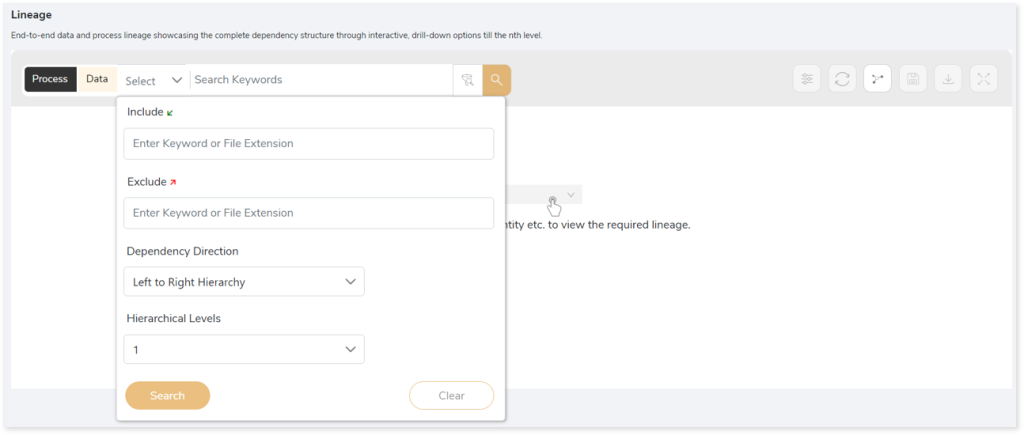
In addition, the filter search icon allows you to include or exclude particular nodes to obtain the required dependency structure. You can also choose the direction of the lineage. By default, the Dependency Direction is Left to Right Hierarchy. You can also choose Right to Left Hierarchy or Bidirectional dependency directions as required. Moreover, you can also increase the Hierarchy Levels to nth level.
Lineage facilitates you visualize how your selected nodes are connected and depend on each other. The nodes and their connecting edges (relationships) help you to understand the overall structure and dependencies.
|
Nodes |
Edges |
 Tables Tables |
 Call Call |
 File File |
 Read Read |
 Job Job |
 Execute Execute |
 Flat File Flat File |
 Write Write |
|
Flat File |
 OTHERS OTHERS |
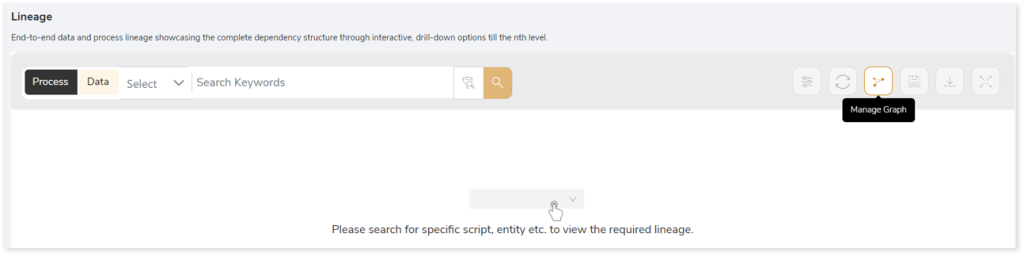
Manage Lineage
This feature enables you to view and manage your lineage. You can add, modify, or delete nodes and their relationships to generate an accurate representation of the required dependency structure. There are two ways to update the lineage: either using Complete Lineage report or Lineage Template.
Using Complete Lineage report
Follow the below steps to modify the lineage:
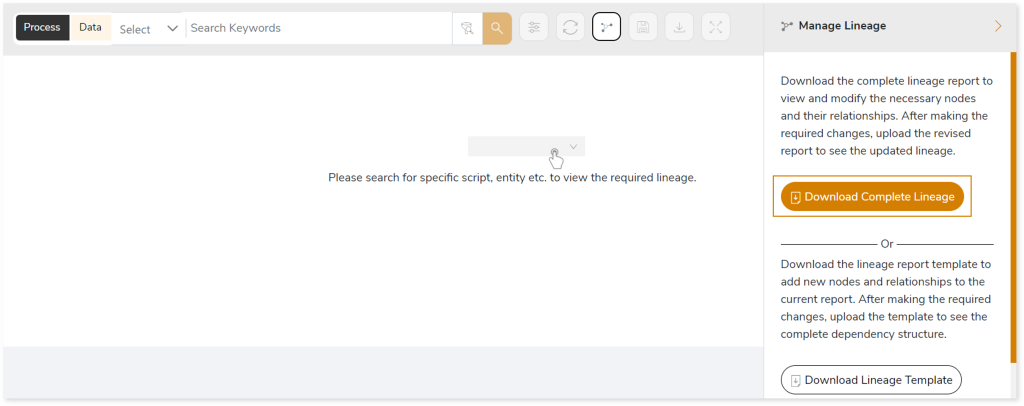
- Click the Manage Graph icon.
- Click Download Complete Lineage to update, add, or delete the nodes and their relationships in the current lineage.
- Once the complete lineage report is downloaded, you can make necessary updates such as updating, deleting or adding the nodes and its relationships.
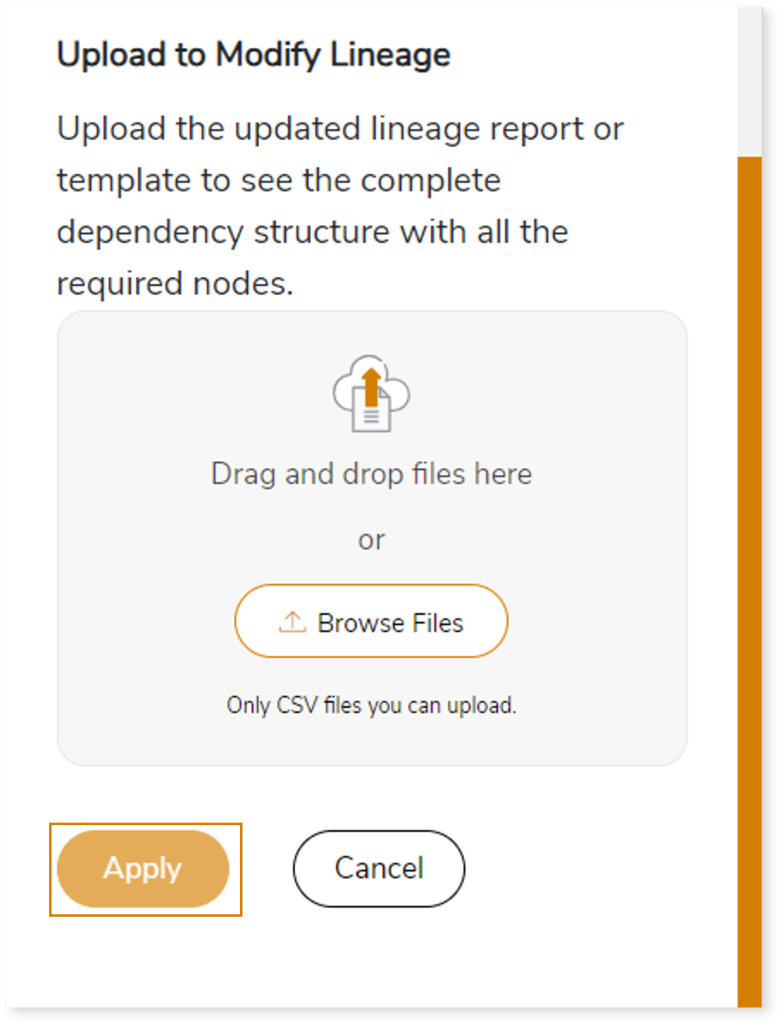
- After making the required changes, upload the updated lineage report in Upload to Modify Lineage.
- Click Apply to incorporate the updates into the dependency structure.
- Generate the required process or data lineage.

Using Lineage Template
Follow the below steps to add new nodes and their relationships to the current lineage report:
- Click the Manage Graph icon.

- Click Download Lineage Template.
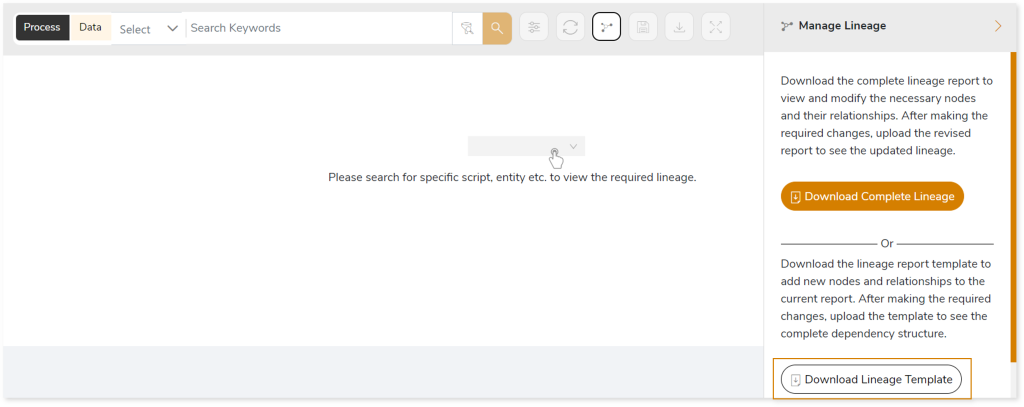
- Once the lineage template is downloaded, you can add new nodes and relationships in the template.
- After making the required changes, upload the template in Upload to Modify Lineage.
- Click Apply to incorporate the updates into the complete dependency structure.
- Generate the required process or data lineage.
Downloadable Reports
Downloadable reports allow you to export detailed Control-M assessment reports of your source data which enables you to gain in-depth insights with ease. To access these assessment reports, click Reports.

Types of Reports
In the Reports section, you can see various types of reports such as Insights and Recommendations, Source Inventory Analysis, and Lineage Analysis. Each report type offers detailed information allowing you to explore your source inventory.

Insights and Recommendations
This report provides an in-depth insight into the source input files. It contains the final output including information about the Control-M jobs. Here, you can see the scheduler folder and ControlM_Assessment_Report.xlsx report.
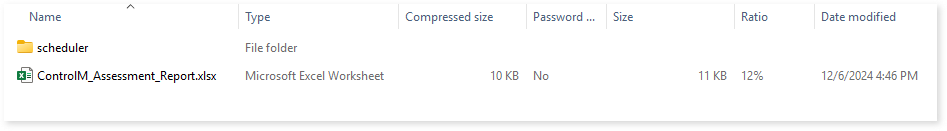
ControlM_Assessment_Report.xlsx: This report provides insights about the source inventory. It includes information about jobs, complexity, unparsed artifacts, etc.
This report contains the following information:
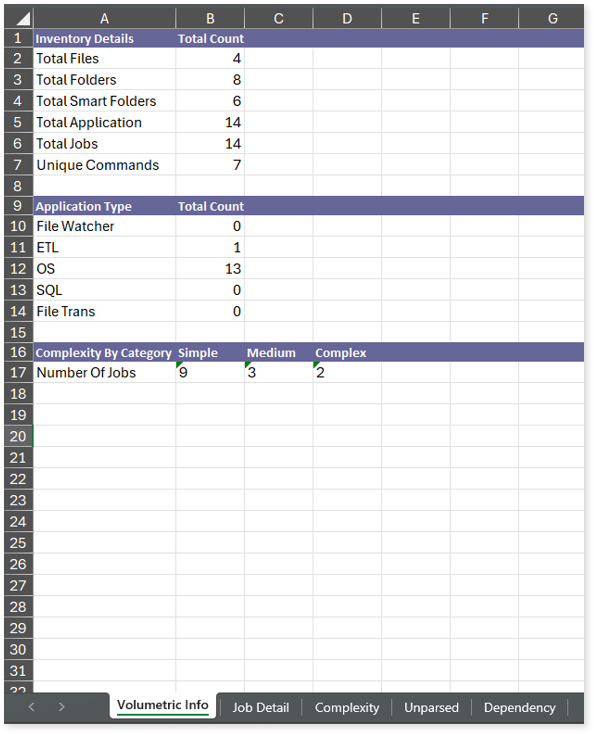
- Volumetric Info: Lists an aggregated inventory of every source Informatica file. For instance, it provides information about the total number of files, folders, smart folders, applications, job complexity, and more.
- Job Detail: Provides information about jobs including applications, sub applications, frequency, complexity, and more.
- Complexity: Provides information about the complexity of jobs present in each file.
- Unparsed: Provides information about unparsed artifacts along with their type and the reason for parsing failure.
- Dependency: Provides dependency details of jobs along with their associated parent job, parent application, parent sub application, and more.
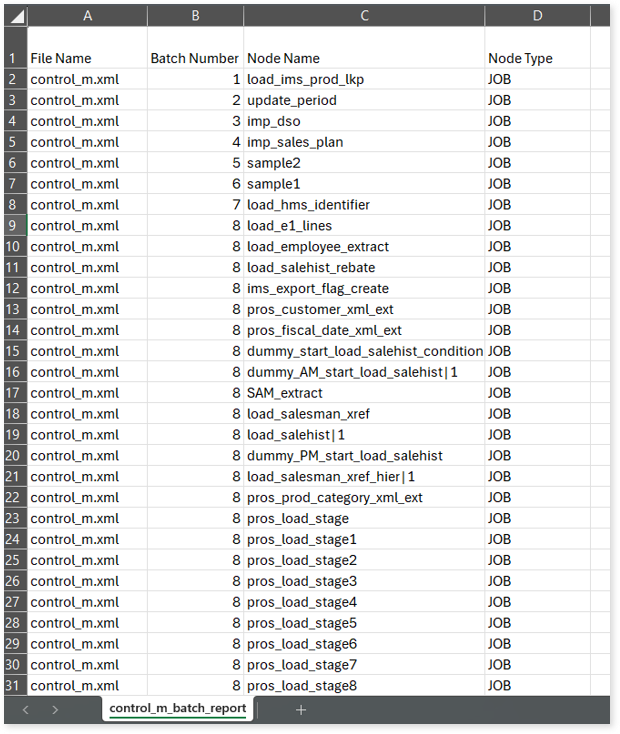
Browse through the scheduler folder to access control_m_batch_report.csv and missing_job_details.csv reports.
missing_job_details.csv: This report provides information about the missing jobs.
control_m_batch_report.csv: This report provides information about batch numbers, nodes, and their types.
Source Inventory Analysis
It is an intermediate report which helps to debug failures or calculate the final report. Here you can see schedular folder along with Lineage_Raw.xlsx report.

Lineage_Raw.xlsx: This report provides complete dependency details for all nodes. It provides an end-to-end data and process lineage that helps to identify the complete dependency structure and the data flow.

This report contains the following information:
- Volumetric Info: Provides volumetric information about the artifact types such as DML files, orchestration jobs, and more.
- Nodes: Lists all the source and target nodes along with its type.
- Dependency (Process): Provides information about the process lineage.
- Dependency (Data): Provides information about the data lineage.
- Dependency (Data Model): Provides dependency details about the data models.
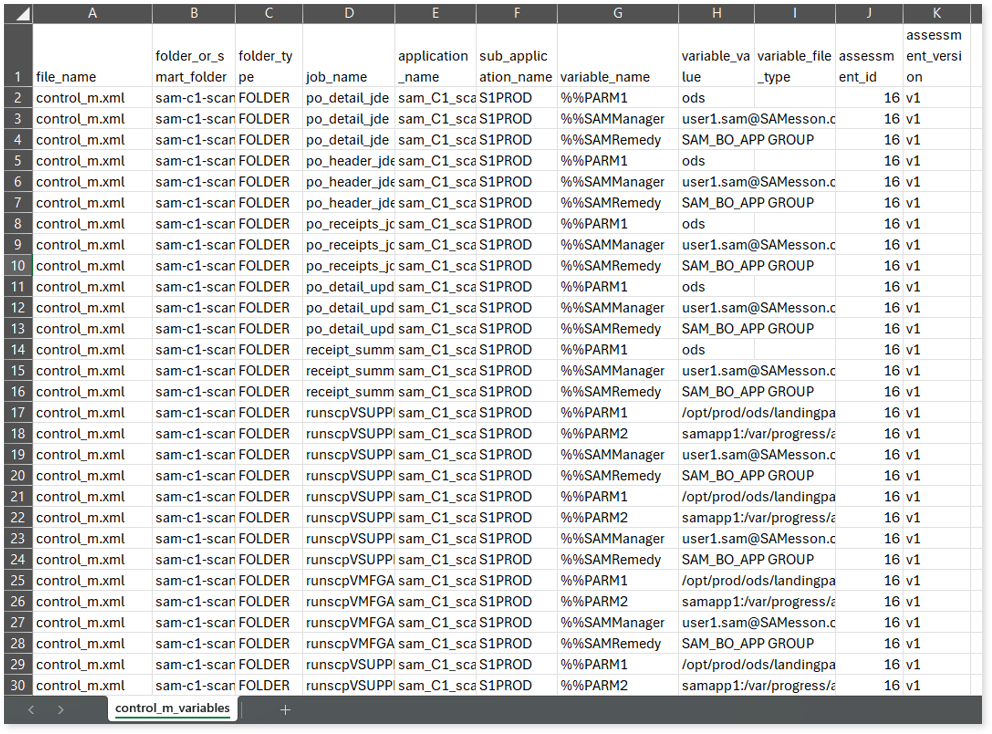
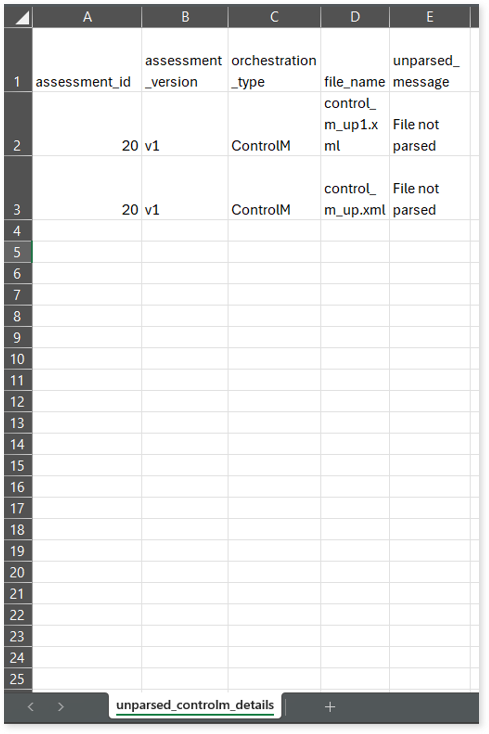
To access various outputs such as control_m_variables.csv, unparsed_controlm_details.csv, and more, navigate through the scheduler > controlm folders.
control_m_variables.csv: This report provides information about all variables defined in the source files.
unparsed_controlm_details.csv: This report provides information about unparsed files.
Lineage Analysis
This section provides lineage-related reports, including entity_link.csv, entity_report.csv, entity_summary.csv, link.csv, script_report.csv reports.
entity_links.csv: This report provides information about how views are connected to entities or tables and how these links extend across multiple levels. Level 1 shows the immediate table to which a view is linked. If that table is further connected to another entity, the next connection appears in Level 2, and so on.
entity_report.csv: This report provides detailed lineage information for each entity within the uploaded source files. It provides a comprehensive list of all entities along with their respective types, identifies the processes or scripts that read from or write to each entity, and includes other dependency details.
entity_summary.csv: This report provides a list of entities from uploaded source files, indicating where they appear (e.g., DML files and Control M Jobs) and the operations performed on them—Read, Write, or ReadWrite.
link.csv: This report provides information about entities linked to each view.
script_report.csv: This report provides detailed lineage information for each script. It lists all scripts along with their type, specifies the processes, jobs, or scripts from which each script reads data and those to which it writes, as well as other dependency details.
