Cloud-to-Cloud Transformation Report
This topic provides a comprehensive report on the Cloud-to-cloud transformation. The Transformation stage contains two sections-Transformation and Assessment Report.
In this Topic:
Transformation
This stage provides the details of the logic and scripts that are transformed or not transformed into the target compactable scripts.
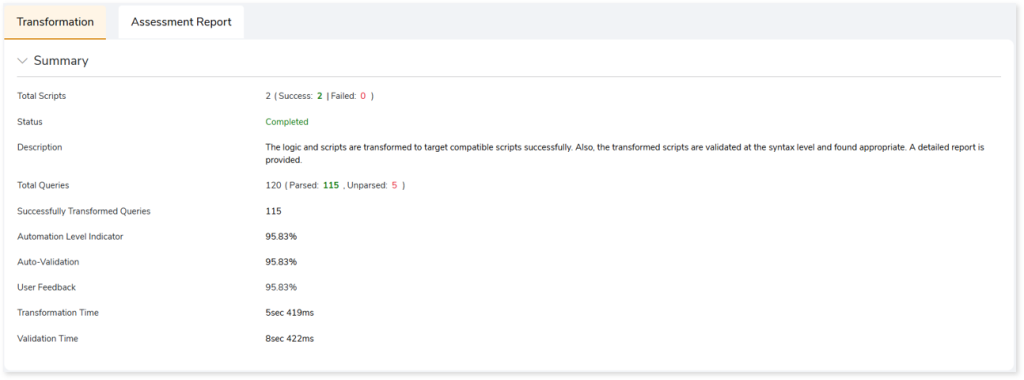
- Total Scripts: Displays the number of scripts you have given as input in the transformation stage. It also gives a segregated view of how many scripts were successfully transformed and how many failed.
- Status: Provides status of the Transformation stage.
- Description: A brief description of the stage is displayed.
- Total Queries: Display the total number of queries present in the scripts along with the number of parsed and unparsed queries.
- Successfully Transformed Queries: Displays the number of queries that have been successfully transformed.
- Automation Level Indicator: Displays the automation conversion coverage.
- Auto-Validation: Displays the percentage of queries that have undergone syntax validation successfully.
- User Feedback: Displays the auto conversion percentage based on your feedback.
- Transformation Time: The time taken for transformation.
- Validation Time: The time taken for validation.
The Transformation section contains three sub-sections. The sub-sections include:
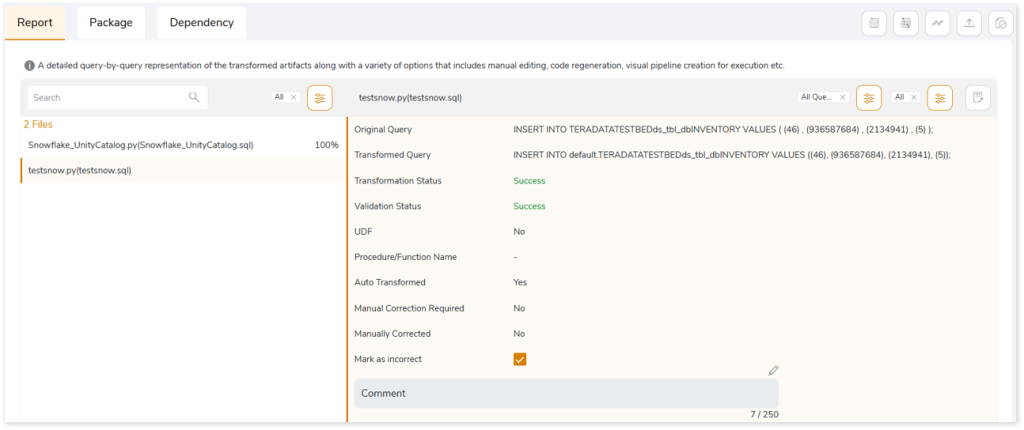
Report
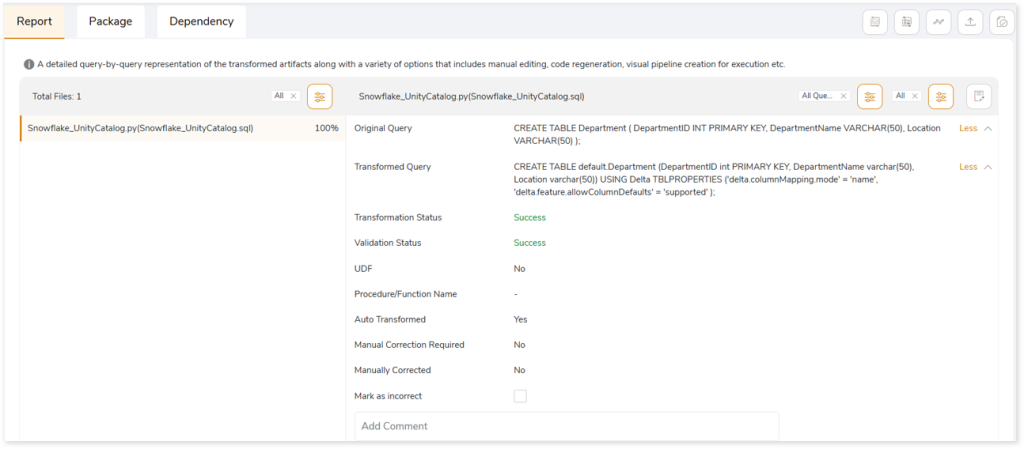
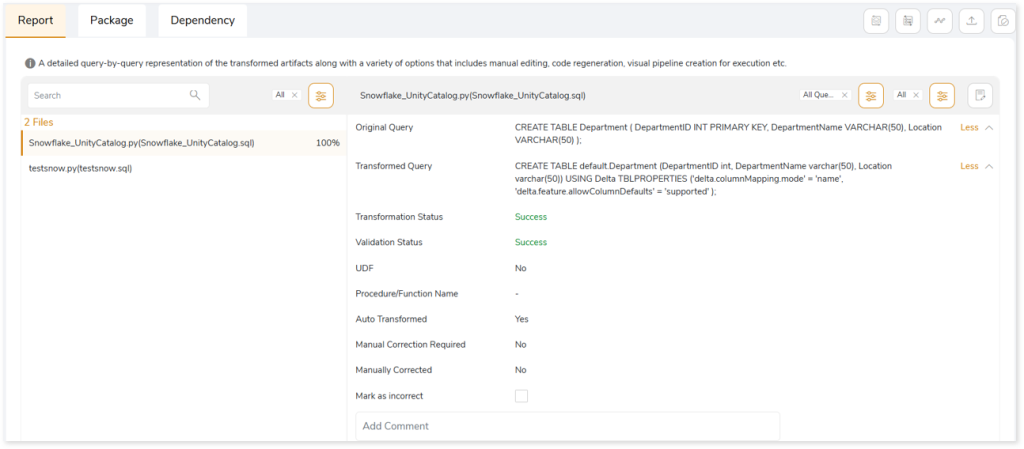
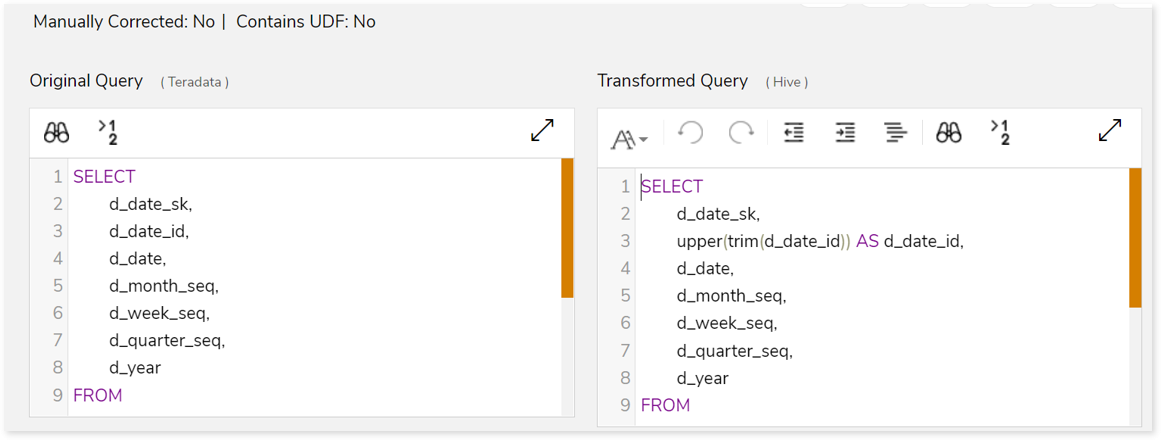
This topic shows a comprehensive report of the converted artifacts. The left panel lists all the input files along with the file-wise transformation percentage. The right panel shows information about the selected file. It includes information about the original and transformed queries, status and more. In addition, if you perceive that a successfully converted query is inaccurate, then you can provide feedback and mark it as incorrect.

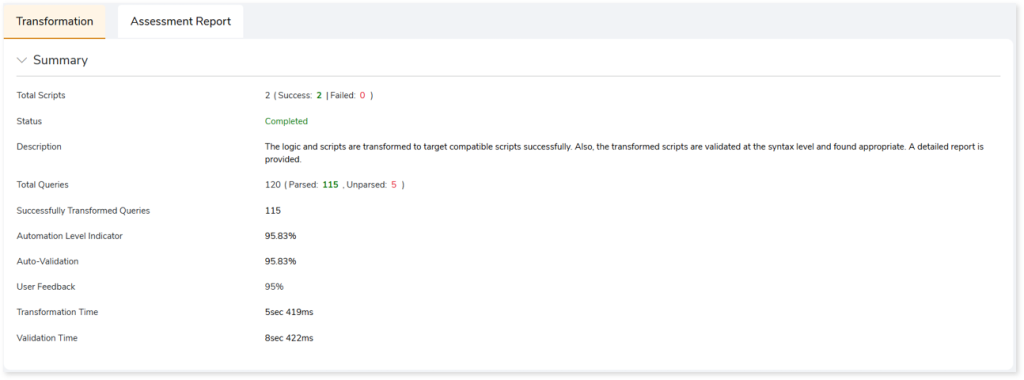
Click Mark as incorrect to show that the converted query is incorrect. Additionally, you can provide detailed feedback in the Comment field to explain the specific issues or discrepancies you have observed. After providing your constructive feedback, click  (Recalculate) to recalculate the automation conversion coverage based on your feedback. This ensures that the converted stage aligns more closely with the intended requirements or desired outcomes.
After clicking (Recalculate), you can see the updated automation conversion coverage (User Feedback) based on your feedback in the Summary section.
When transforming workloads to Databricks Lakehouse with the Unity Catalog enabled, constraints such as primary key, foreign key, check, etc., present in the source data are transformed to Databricks-native equivalent. As depicted in the image below, original queries are converted to Databricks-equivalent code along with the constraints.
If the Utility Catalog is disabled, the default Hive metastore is utilized. In such cases, workloads are converted to Databricks-equivalent code without any constraints.
In addition, you can also take a variety of actions, including:
|
Feature |
Icon |
Description |
|
Query Recommendation |
 |
To get instant recommendations for improving the performance of the queries based on best practices for query construction. To apply Query Recommendations, choose:
- Apply All: To apply query recommendations to all the queries.
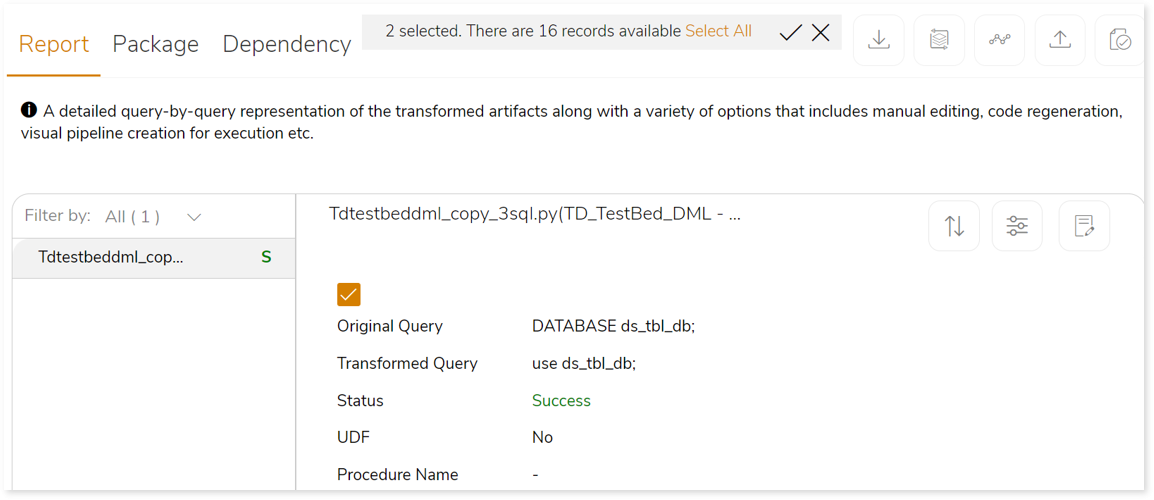
- Custom Selection: Specify the queries to apply query recommendations. To do so,
- Click Custom Selection.
- Select the queries by checking the check boxes of respective queries.
- Click
 to get the recommendation for query optimization. to get the recommendation for query optimization.
If the recommendations for query optimization are carried out successfully, the system generates a snackbar popup to notify the success.

|
|
Download |
 |
Download the transformed artifacts (sh scripts, java files, etc.), validation report, and executable jar file as a zip. |
|
Regenerate |
 |
Edit the transformed queries using the notebook-based online editor. Update and repackage your code after making the necessary changes to apply the updated query. The Regenerate feature helps to update and repackage your query in the Transformation stage.
If the artifacts are updated successfully, the system generates a snackbar popup to notify the success.  |
|
Create Pipeline |
 |
The transformed code can be reformed into a visual pipeline on the Stream Analytic platform where the transformed code can be orchestrated and executed effortlessly. |
|
Update |
 |
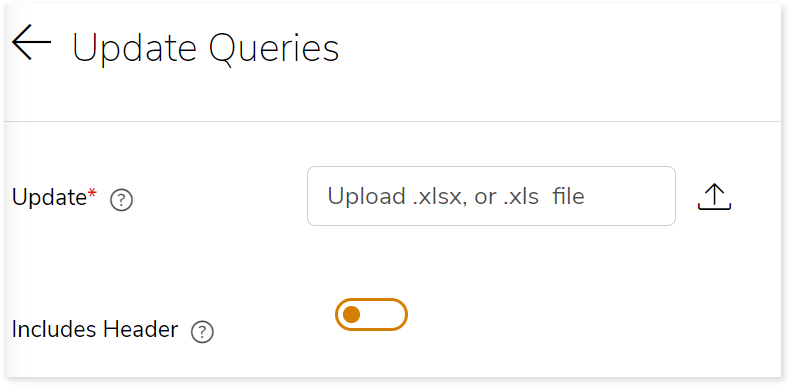
To upload the updated query files to replace the manually corrected queries:
- Click .
- Upload the updated query file (.xlsx or .xls file) in the Update field to replace the auto-transformed queries with the manually corrected queries.
- Enable Includes Header toggle if the first row contains column names in the uploaded files.
|
|
Validate |
 |
To validate the replaced queries. |
|
Compare |
 |
Line-by-line comparison of the transformed queries and the source queries to identify the changes. 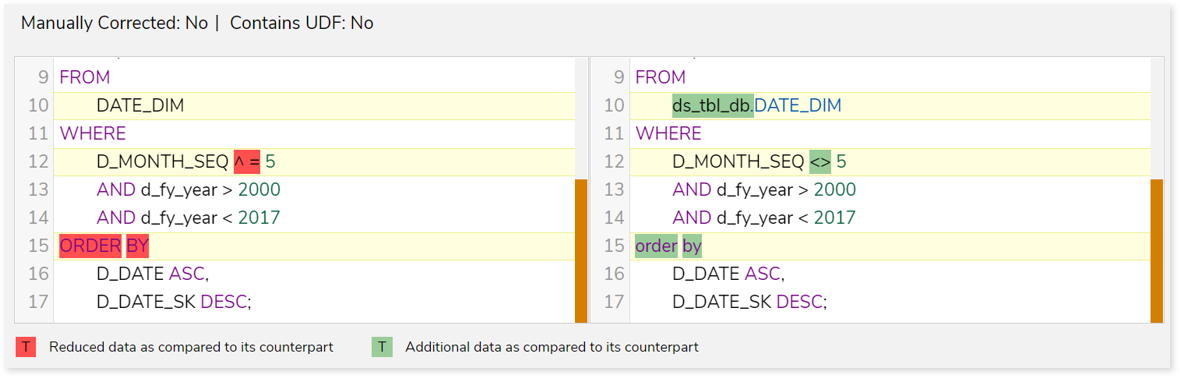 |
|
Edit |
 |
To manually edit failed queries using the Notebook-based online editor. Furthermore, you can repackage the updated code with the Regenerated option. To do so,
- Click .
- Make the necessary changes in the transformed queries.
- Click
 to update the queries. to update the queries.
|
|
Sort |
 |
To sort the queries. You can sort the queries based on:
- All Queries
- Success Queries
- Failed Queries
- Manually Corrected
- Recommendation: Yes
- Recommendation: No
|
|
Filter |
 |
To filter the queries based on the query type. |
|
View Notebook |
 |
To manually edit failed queries using the Notebook-based online editor. Furthermore, you can repackage the updated code with the Regenerated option. To do so,
- Click .
- Make the necessary changes in the transformed queries.
- Click to update the queries.

|
Package
This section provides a detailed report of the converted artifacts containing python files, sql files, etc. along with an executable jar file.
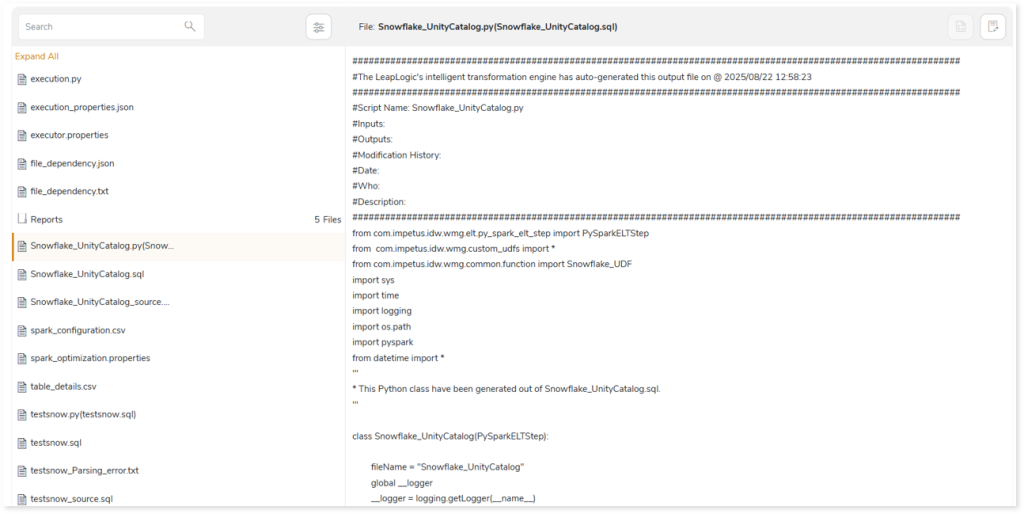
In the converted artifact (output .py file), if any query fails or cannot be converted to the target equivalent, a detailed error specification is displayed. This enhances visibility and improves troubleshooting efficiency. To effectively diagnose and track issues, detailed information is provided in the following message formats: Info, Error, Warning, ToDo, and Alert.
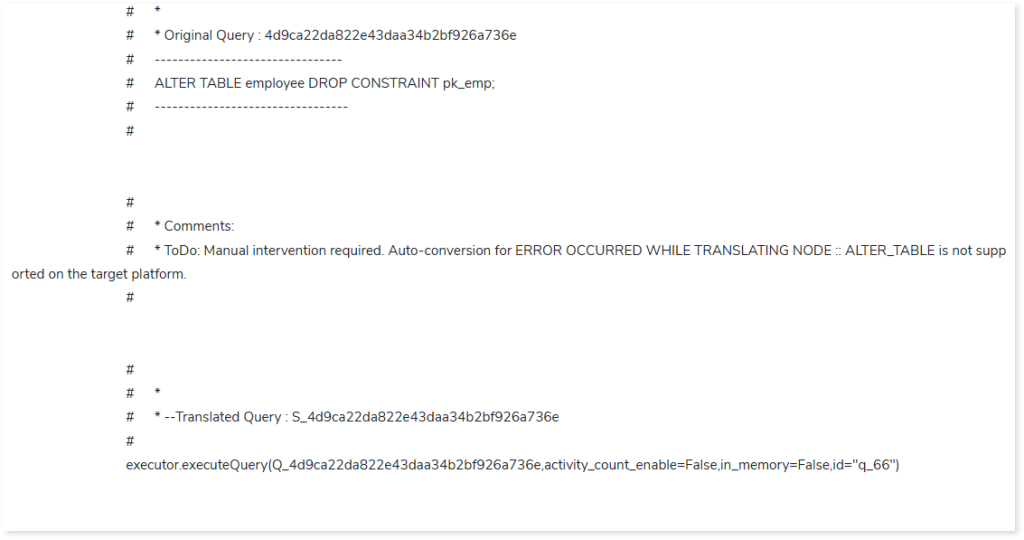
To see a comprehensive guidance on error specifications and troubleshooting, refer Error Specifications & Troubleshooting.
In the Reports folder under the Package section, you can see the Transformation_Report.xlsx file. This report contains details of transformation, including deductible license quota, and queries. The Query Summary sheet in this file provides information about the queries segregated by statement types along with auto-converted and manually corrected queries.
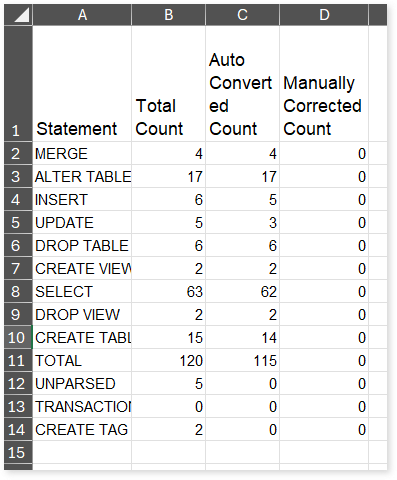
- Statement: Displays the statement types.
- Total Count: Displays the number of queries for each statement type.
- Auto Converted Count: Displays the number of queries that are automatically converted for each statement type.
- Manually Converted Count: Displays the number of queries that require manual intervention for each statement type.
The Summary sheet in Transformation_Report.xlsx file showcases detailed information about the license deductible quota.
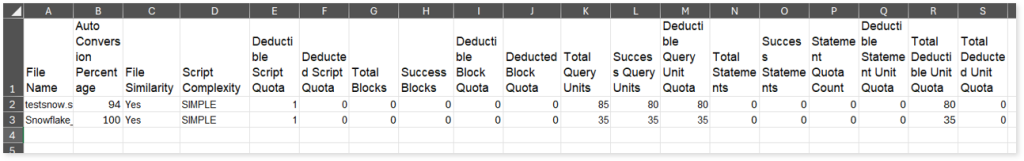
- File Name: Displays the name of the file.
- Auto Conversion Percentage: Displays the auto-conversion percentage of each script.
- File Similarity: Indicates whether the file is similar to the already executed file. If the value is Yes, then the file is similar to an already executed file else No. If the file is similar to the already executed file, then the Deducted Script Quota and Deducted Unit Quota will be zero and will not deduct any quota.
- Script Complexity: Displays the complexity of each file.
- Total Blocks: Displays the total number of blocks.
- Success Blocks: Displays the number of successfully transformed blocks.
- Total Units: Displays the total number of units.
- Success Units: Displays the number of successfully transformed units.
- Deductible Unit Quota: Displays the unit quota that needs to be deducted based on the complexity checks and balances.
- Deducted Unit Quota: Displays the actual unit quota deducted from license.
The Transformation Report sheet lists all the queries along with their type, auto generated query, status, complexity and more.
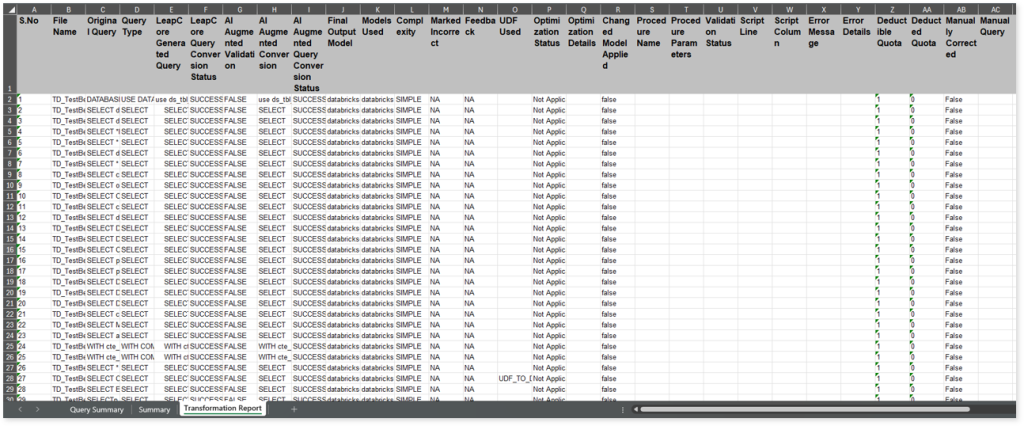
- File Name: Displays the name of the file.
- Original Query: Displays the original query.
- Query Type: Displays the query type.
- LeapCore Generated Query: Displays the query generated by the LeapLogic Core engine (LeapCore).
- LeapCore Query Conversion Status: Displays the conversion status of each query converted by LeapCore. If the value is SUCCESS the query is converted successfully, else FAILED.
- AI Augmented Validation: Displays the validation status of the query generated by the LeapLogic Core engine (LeapCore) using the Review models (LLM models to review and validate queries).
- AI Augmented Conversion: Displays the query generated by the LLM model.
- AI Augmented Query Conversion Status: Displays the conversion status of each query converted by the LLM model. The converted queries are validated using the Review models. If the value is SUCCESS, the query was converted successfully; otherwise, it is FAILED.
- Final Output Model: Displays the name of the model used to generate the final converted query.
- Models Used: Displays all names of all the models involved in the conversion process.
- Complexity: Displays the query complexity.
- Marked Incorrect: Indicates whether you have marked the converted query as incorrect or correct. To populate this column values:
- Select the Mark as incorrect or Mark as correct option available in the Transformed Query (under Reports section in the Transformation report). For example, flag a successfully transformed query as incorrect or flag a failed query as correct.
- Provide detailed feedback in the Add Comment field explaining the specific issues or discrepancies.
- Click the Regenerate icon to regenerate the transformation artifacts and repackage them in the Transformation stage.
- The Marked Incorrect and Feedback columns in the transformation report will display the updated details.
The Marked Incorrect column displays the following values:
- N/A: Displays by default when you execute the pipeline or when no query has been marked as incorrect/ correct.
- Yes: Indicates that the converted query has been marked as incorrect/ correct.
- No: Indicates that the query was previously marked as incorrect/ correct, but the feedback has been reverted.
- Feedback: Displays the feedback provided in the Add Comment field in the Transformed Query (under Reports section in the Transformation report). By default, it displays N/A when you execute the pipeline, or no feedback has been added.
- UDF Used: Displays the user-defined functions used in each query.
- Optimization Status: Indicates whether the transformed query is optimized for better performance and efficiency.
- If the Optimization Status is Optimized, the query is optimized for the target environment.
- If the Optimization Status is Not Applicable, the query is not applicable for optimization.
- Optimization Details: Describes the optimization techniques applied to enhance query performance.
- Changed Model Applied: Provides information on any applied changes to the model. It is a mapping between source and target tables as well as columns along with a definition of the mapping condition such as Inner Join, etc.
- Procedure Name: Displays the name of the procedure.
- Procedure Parameters: Displays the number of parameters in each procedure.
- Validation Status: Displays the status of query validation.
- Script Line: Displays the number of lines present in each query/ procedure.
- Script Column: Displays the number of columns that are used in the query.
- Error Message: Shows a brief message of auto-conversion or query validation failure.
- Error Details: Shows a detailed message of auto-conversion or query validation failure.
- Deductible Quota: Displays the unit quota that needs to be deducted based on the complexity checks and balances.
- Deducted Quota: Displays the actual unit quota deducted from the license.
- Manually Corrected: Indicates whether the query needs manual intervention.
- Manual Query: Displays manually updated queries.
You can apply:
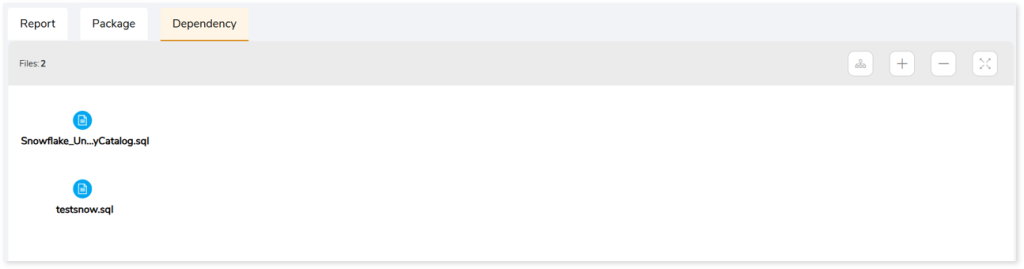
Dependency
It illustrates the complex interdependencies between various enterprise workloads through a process lineage graph. Whenever one database is dependent upon another, or when one table is dependent upon another, to demonstrate this relationship, lineage or dependency graphs are generated.
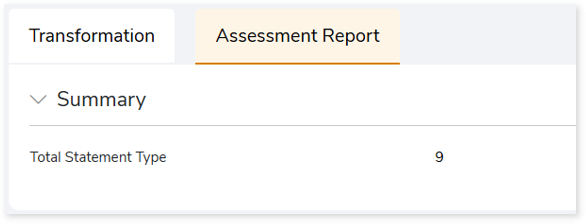
Assessment Report
This section displays a summary of all the statement types in the transformation stage.