Azure Data Factory Assessment Report
This topic contains information about the Azure Data Factory assessment report. The assessment assesses workloads and produces in-depth insights that help plan the migration. The Azure Data Factory assessment supports only ZIP files (ARM template) as input files.
To learn how to export an ARM template from the Azure portal, click Export ARM Template.
In This Topic:
Highlights
The highlights section gives you a high-level overview of your assessment summary of the analytics performed on the selected workloads. It includes information about resource types and pipelines.
Summary
This section summarizes the source scripts and the associated workload inventory. It includes information about pipelines, activities, resources, procedures, and so on.
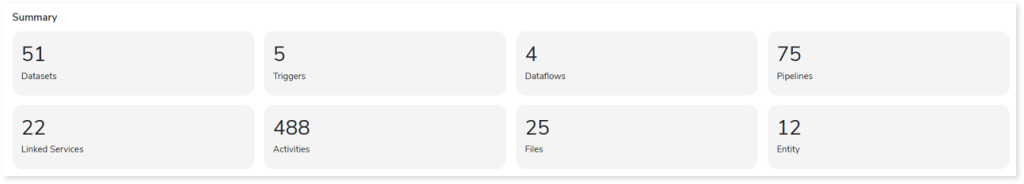
- Datasets: Displays the number of datasets present in the source files.
- Triggers: Displays the number of triggers present in the source files.
- Dataflows: Displays the number of data flows present in the source files. In ADF, data flow is used to visually design and perform complex data transformations within pipelines.
- Pipelines: Displays the number of pipelines present in the source files. A pipeline is a logical grouping of activities used to accomplish a task or workflow.
- Linked Services: Displays the number of linked services present in the input source files.
- Activities: Displays the number of activities in the source files. Each pipeline can contain multiple activities. Activities are primary components that specify actions such as validating data, deleting data, obtaining metadata, etc.
- Files: Displays the total number of input files.
- Entity: Displays the number of entities used in the datasets.
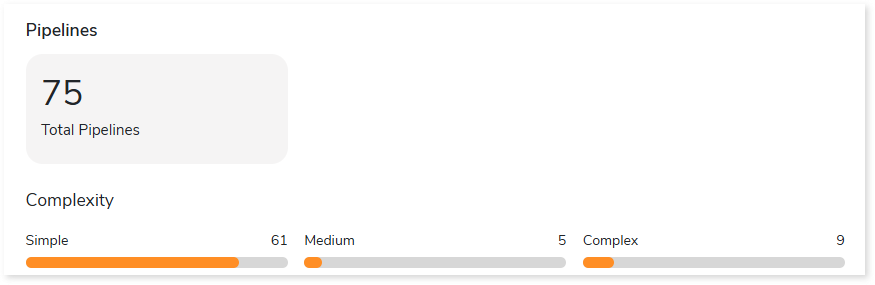
Pipelines
This section provides information about the total number of pipelines in the entire inventory along with the complexity breakup.
Queries
This section provides information about the total, unique, analyzed, and This section provides information about the total, unique, analyzed, and unanalyzed queries in the entire inventory.
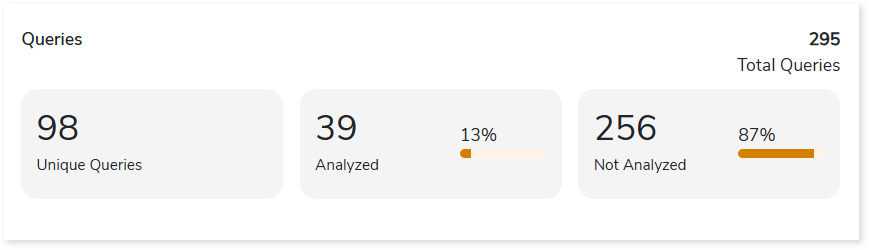
- Total Queries: Displays the total number of queries.
- Unique Queries: Displays the number of unique queries.
- Analyzed: Displays the number of analyzed queries.
- Not Analyzed: Displays the number of unanalyzed queries.
Analysis
This topic provides a detailed examination of the source files.
Files
This section provides a comprehensive report of the source files along with information about the total number of files, pipelines, activities, datasets, and so on.
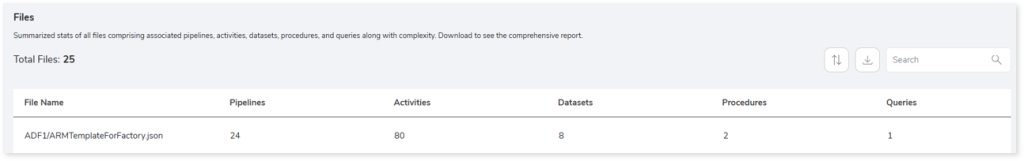
- File Name: Displays the file name. The used naming convention is folder_name/file_name.
- Pipelines: Displays the number of pipelines existing in the file. Pipeline is a set of activities to accomplish a task or work.
- Activities: Displays the number of activities. Each pipeline contains multiple activities. Activities are primary components that specify the actions such as validating data, deleting data, obtaining metadata, etc.
- Datasets: Displays the number of datasets. It is a collection of data which is used in various activities.
- Procedures: Displays the number of procedures. Procedures are a set of SQL queries to perform an action or task.
- Queries: Displays the number of queries.
Pipelines
This section provides detailed information about pipelines, including their activities, complexity, dependency conditions, and relative files.
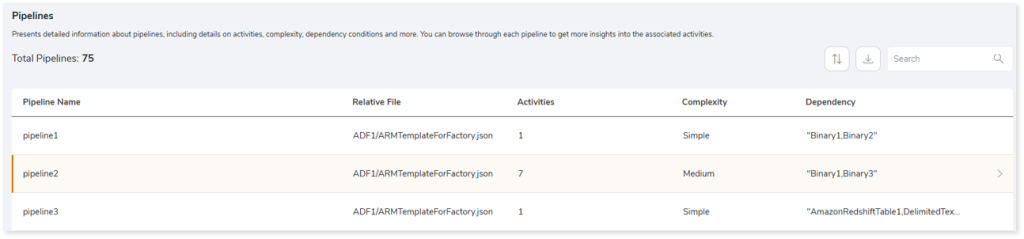
- Pipeline Name: Displays the name of the pipeline.
- Relative File: Displays the relative file path on which the pipeline is available.
- Activities: Displays the number of activities in each pipeline.
- Complexity: Displays the pipeline complexity.
- Dependency Conditions: Provides details about the resources on which the pipeline depends. For instance, the pipeline may be dependent on other pipelines, datasets, link services, etc.
Browse through each pipeline to get more insights into the associated activities.
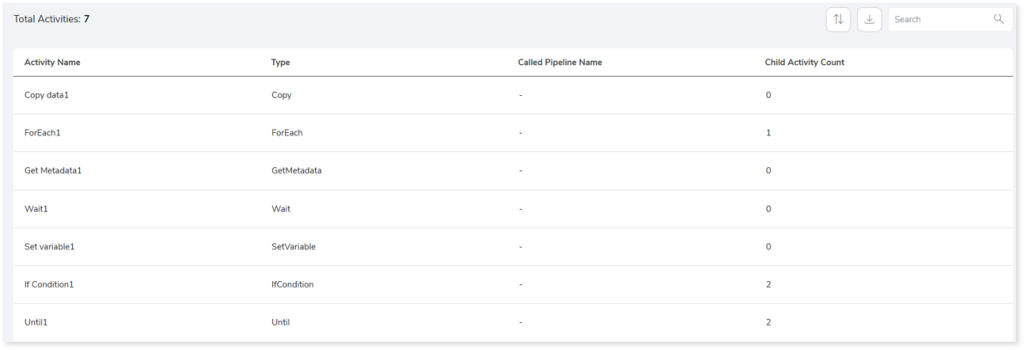
- Activity Name: Displays the name of the activity.
- Type: Displays the type of activities carried out within the pipeline such as copying data, filtering data, get metadata, etc.
- Called Pipeline Name: Displays the name of the pipeline called by the activity.
- Child Activity Count: Displays the number of child activities.
Resources
This section provides detailed information about various resource types such as datasets, linked services, triggers, and Data flows. Resources are manageable services or entities, for instance, databases, storage accounts, virtual networks, etc.
Datasets
This section lists all the datasets. Datasets are a collection of data that is used in various activities.
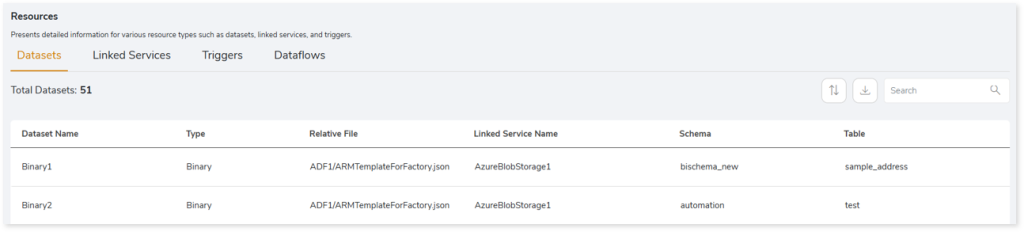
- Dataset Name: Displays the name of the dataset.
- Type: Displays the dataset type.
- Relative File: Displays the relative file path of the dataset.
- Linked Service Name: Displays the name of the linked service associated with the dataset.
- Schema: Displays the associated schema name.
- Table: Displays the associated table name.
Linked Service
This section lists all the linked services. Linked services are connection strings that contain connection details such as databases, URLs, file paths, etc., to connect to different services (cloud, legacy data warehouses, etc.).
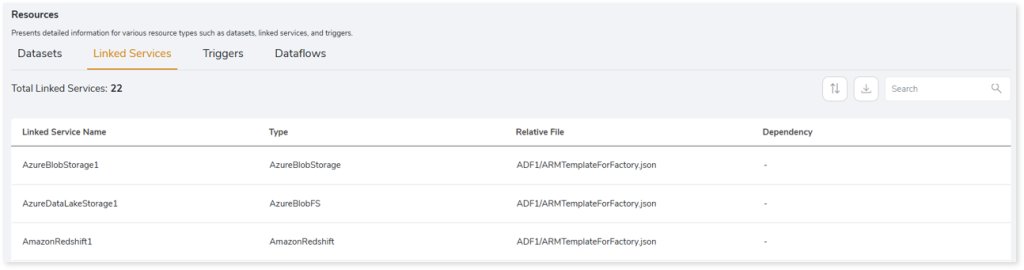
- Linked Service Name: Displays the name of the linked service.
- Type: Displays the type of the linked services.
- Relative File: Displays the relative file path of the linked services.
- Dependency: Provides details about the resources on which the linked service depends. For instance, the linked service may be dependent on other datasets, link services, etc.
Trigger
This section lists all triggers. Triggers are used to execute a pipeline.
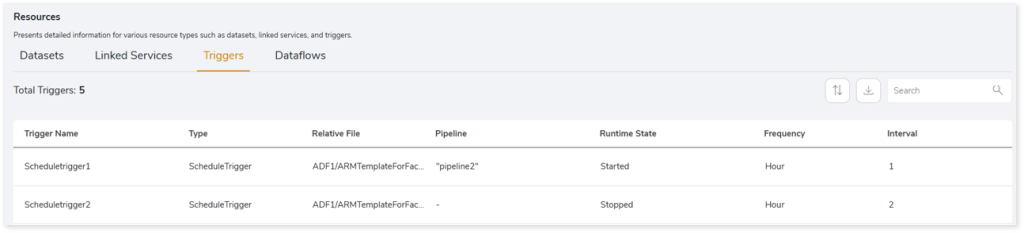
- Trigger Name: Displays the name of the trigger.
- Type: Displays the type of trigger. There are three types of triggers:
- Schedule: Execute the pipeline based on a predefined schedule.
- BlobEvents: Execute the pipeline when a new or updated Azure blob storage is identified.
- Tumbling window: Execute the pipeline at a periodic interval irrespective of past and future dated data.
- Relative File: Displays the relative file path of the trigger.
- Pipeline: Displays the pipeline associated with each trigger.
- Runtime State: Specifies the runtime state of each trigger, such as started or stopped.
- Frequency: Displays the frequency such as hour, minute, etc., at which the trigger is scheduled to execute.
- Interval: Provides the time interval at which the trigger is scheduled to execute.
Dataflows
This section lists all the data flows. In ADF, data flow is used to visually design and perform complex data transformations within pipelines.
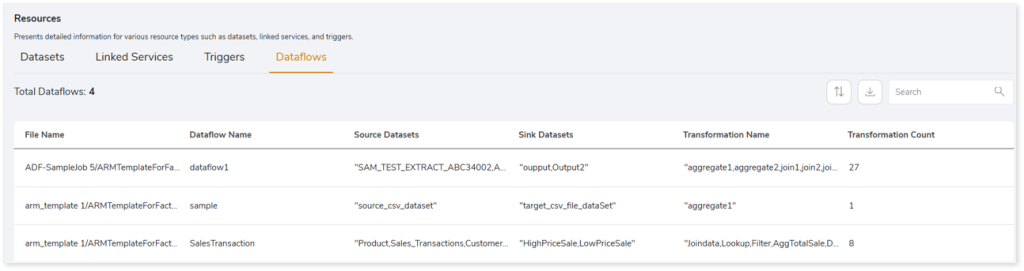
- File Name: Displays the name of the file that contains the data flow.
- Dataflow Name: Displays the name of the data flow.
- Source Datasets: Displays the source datasets associated with each data flow.
- Sink Datasets: Displays the sink or target datasets associated with each data flow.
- Transformation Name: Displays the transformations associated with each data flow.
- Transformation Count: Displays the number transformations associated with each data flow.
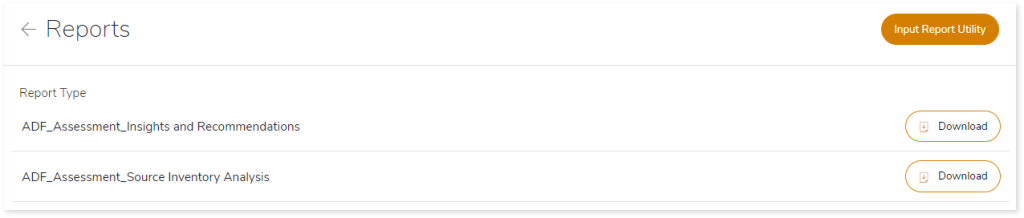
Downloadable Reports
Downloadable reports allow you to export detailed ADF assessment reports of your source data which enables you to gain in-depth insights with ease. To access these assessment reports, click Reports.

Types of Reports
In the Reports section, you can see various types of reports such as Insights and Recommendations, and Source Inventory Analysis. Each report type offers detailed information allowing you to explore your assessment results.
Insights and Recommendations
This report provides an in-depth insight into the source input files.
ADF Assessment Report.xlsx: This report provides insights about the source inventory. It includes information about the source inventory and pipelines.
This report contains the following information:
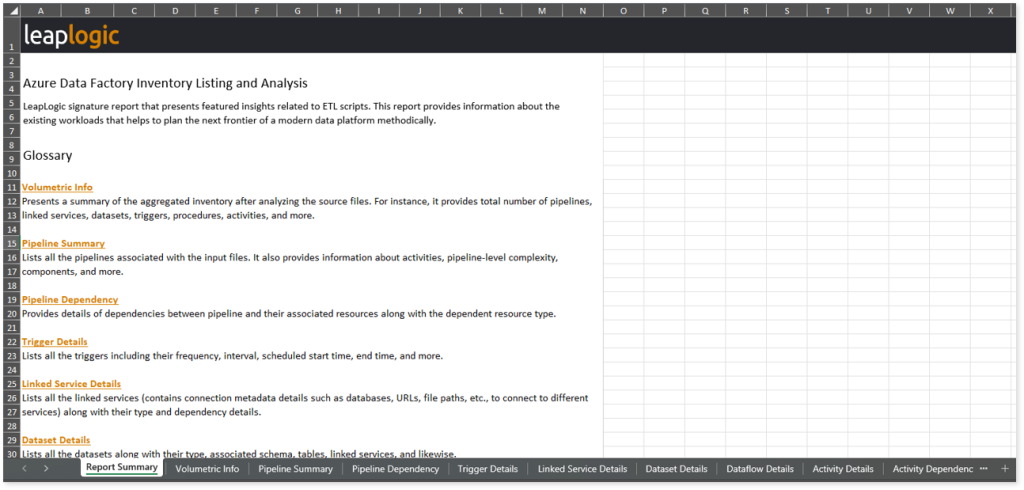
- Report Summary: Provides information about all the generated artifacts.
- Volumetric Info: Presents a summary of the aggregated inventory after analyzing the source files. For instance, it provides total number of pipelines, linked services, datasets, triggers, procedures, activities, and more.
- Pipeline Summary: Lists all the pipelines associated with the input files. It also provides information about activities, pipeline-level complexity, components, and more.
- Pipeline Dependency: Provides details of dependencies between pipeline and their associated resources along with the dependent resource type.
- Trigger Details: Lists all the triggers including their frequency, interval, scheduled start time, end time, and more.
- Linked Service Details: Lists all the linked services (contains connection metadata details such as databases, URLs, file paths, etc., to connect to different services) along with their type and dependency details.
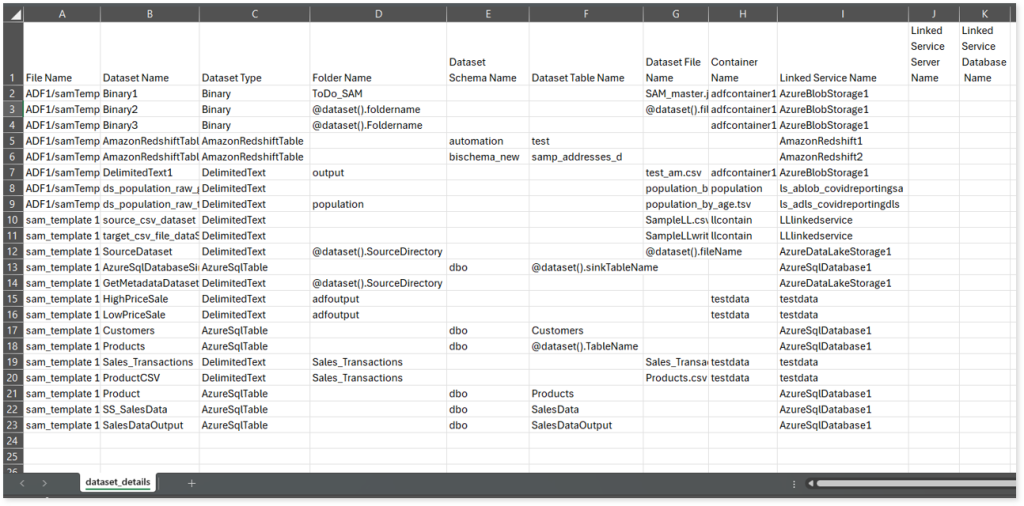
- Dataset Details: Lists all the datasets along with their type, associated schema, tables, linked services, and likewise.
- Dataflow Details: Provides information about dataflows, including the source dataset, target dataset, associated transformations, and more.
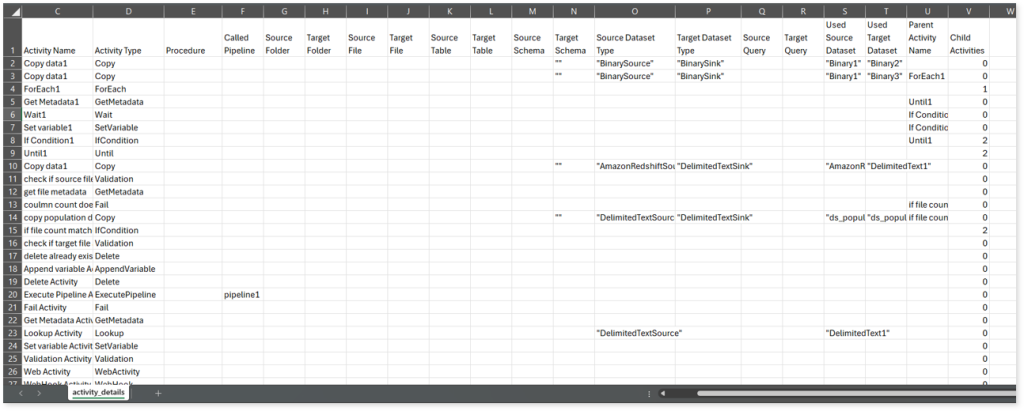
- Activity Details: Lists all the activities along with their type, procedure, source and target folders, files, used datasets, and more.
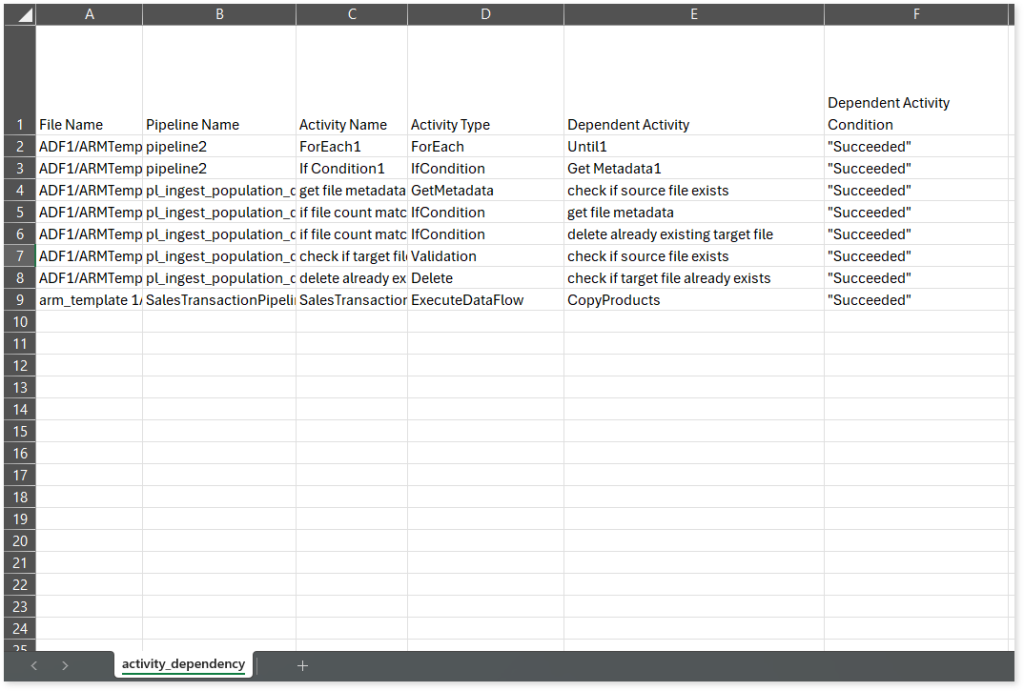
- Activity Dependency: Provides details of dependencies between activities including the dependent activity, activity type, and dependency condition. Dependent activities vary according to the Succeeded or Failed conditions defined in the input source file.
Source Inventory Analysis
It is an intermediate report which helps to debug failures or calculate the final report. It includes all the generated CSV reports.
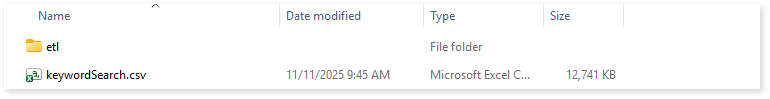
keywordSearch.csv: Provides detailed insights into keyword occurrences— specifically pipelines—identified across all uploaded source files. It captures information such as the search type, the file where the keyword was found, the line number of occurrence, and the actual line content where the keyword appears.
The system dynamically extracts a specific list of keywords (Pipelines) from the pipeline_summary.csv assessment output report. These extracted keywords are then used to perform a case-insensitive search across all uploaded artifacts to help you to understand where specific pipelines are referenced.
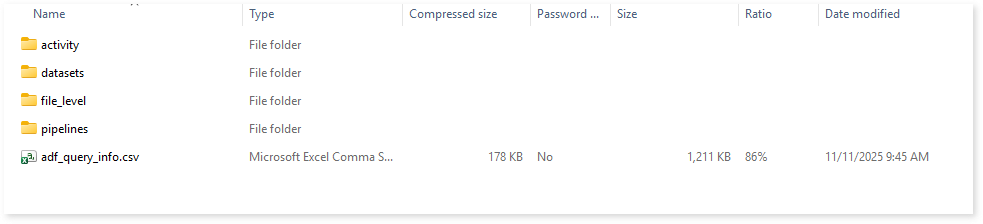
Browse through the etl > adf folders to view the subfolders—activity, datasets, file_level, and pipelines—along with the adf_query_info.csv report.
Browse through activity subfolder to access activity_dependency.csv and activity_details.csv reports.
activity_dependency.csv: This report provides details about each activity, including its dependent activity, activity type, and other related data.
activity_details.csv reports: This report provides detailed information about activities, including their type, procedure, called pipeline, source and target folders, tables, and more.
Browse through dataset folder to access dataset_details.csv report.
dataset_details.csv: This report provides detailed information about datasets, including type, container, linked service, and more.
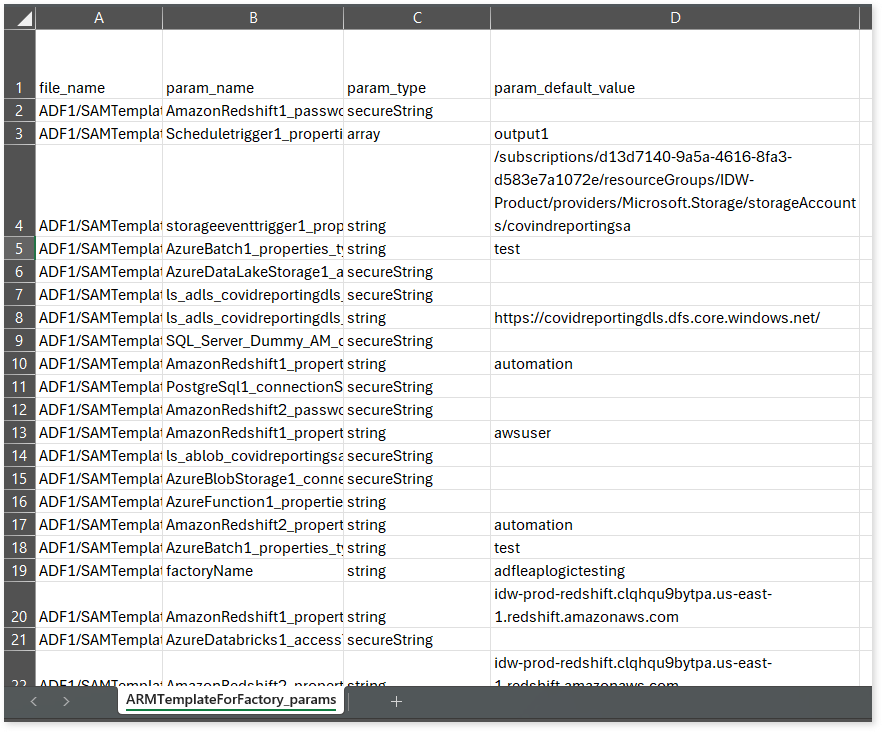
In the file_level folder, you can find parameter details for each file. For example, if the file name is ARMTemplateForFactory, the report will be ARMTemplateForFactory_params.csv.
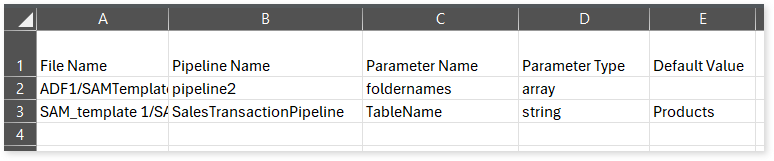
ARMTemplateForFactory_params.csv: This report provides detailed information about parameters, including their type and default value.
Browse through pipelines folder to access Pipeline Parameter.csv, pipeline_dependency.csv, and pipeline_summary reports.
Pipeline Parameter.csv: This report provides detailed information about parameters used in the pipeline, including their type and default value.
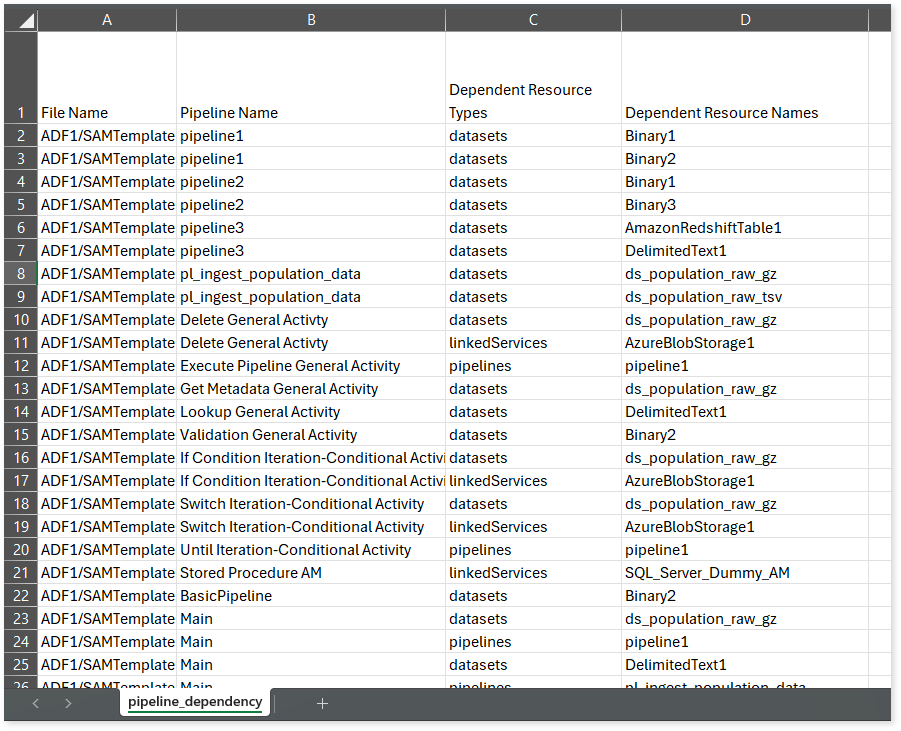
pipeline_dependency.csv: This report provides information about pipelines, including their dependent resources and the types of those resources.
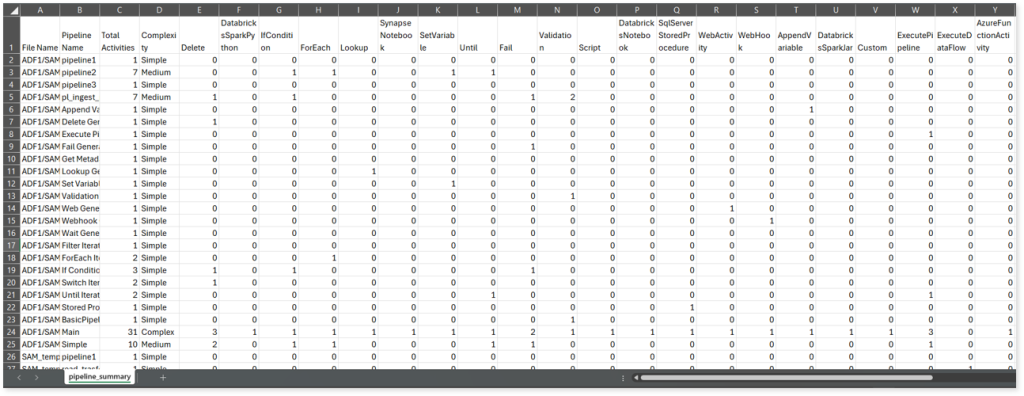
pipeline_summary.csv: This report provides detailed information about pipelines, including the total number of activities, their complexity, and the types of activities used, such as Delete, DatabricksSparkPython, IfCondition, ForEach, and more.
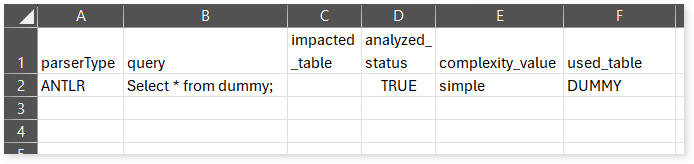
adf_query_info.csv: This report provides information about queries including their type, complexity, parser type, used table, and more.