Analysis
This topic provides a detailed examination of applications, users, queries (by statement types and query constructs), entities, files, and more. Based on the pre-defined SLAs, cost, resource consumption, etc., the Analysis page shows a glimpse into the most eligible workloads for migration.
In this Topic:
DML Script
Applications
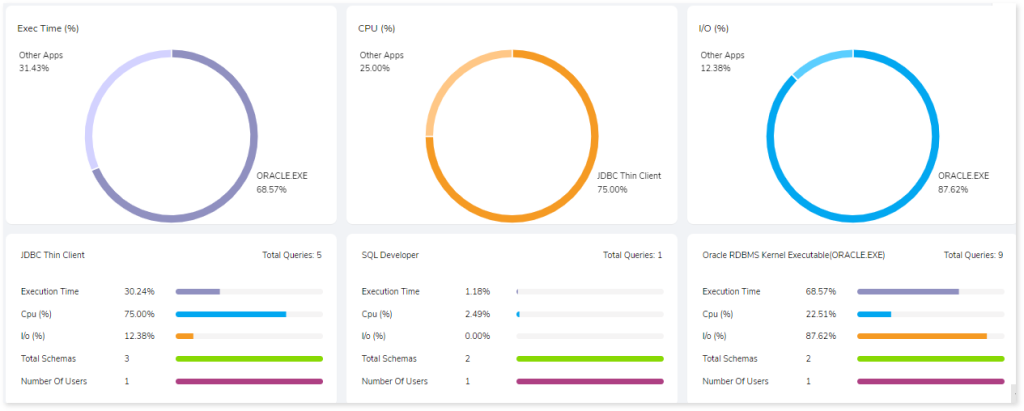
This section provides a summary for all the applications comprising of execution time required for the application, CPU, and I/O utilization of applications and so on.
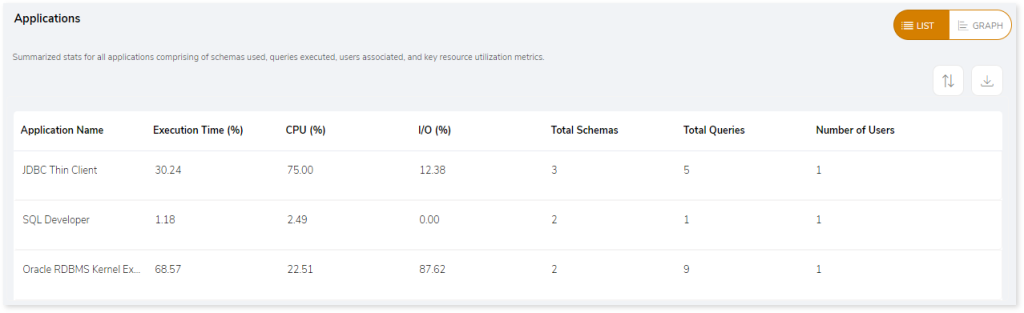
- Application Name: Name of the application.
- Execution Time (%): Percentage of time required to execute the application.
- CPU (%): Percentage of CPU utilization.
- I/O (%): Percentage of I/O utilization.
- Total Schemas: Provides the total number of schemas.
- Total Queries: Provides the total number of queries.
- Number of Users: Provides the total number of users in the application.
Browse through each application to get more information about the queries, schemas, and users.
Queries
Displays a list of queries along with its analysis status, complexity and so on.
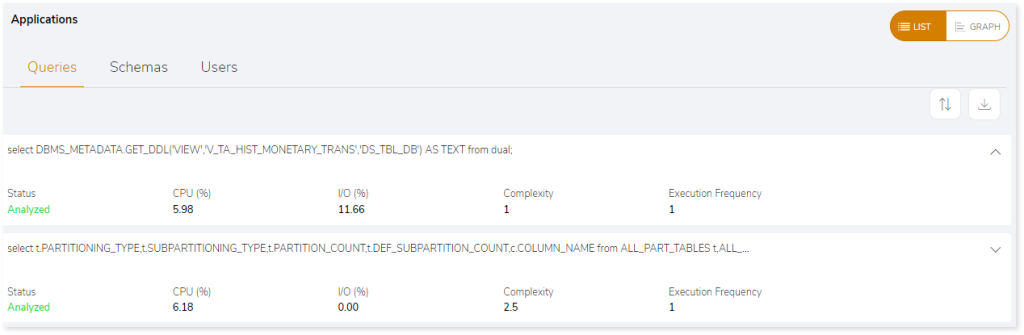
- Status: Displays the query analysis status as Analyzed or Not Analyzed.
- Analyzed: Indicates the query is analyzed.
- Not Analyzed: Indicates the query is not analyzed due to some impediments. If the query status is not analyzed, then it displays the reason for failure.
- CPU (%): Percentage of CPU utilization.
- I/O (%): Percentage of I/O utilization.
- Complexity: Provides the complexity of queries.
- Execution Frequency: Provides the frequency of execution.
Schemas
Displays a list of schemas along with the execution time, number of tables, and so on.
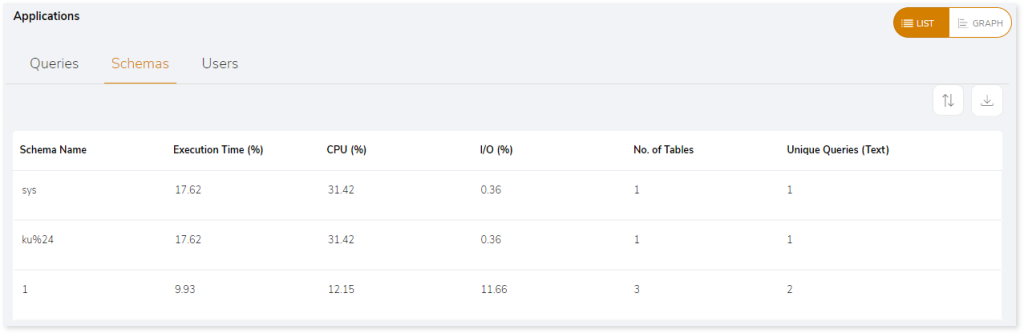
- Schema Name: Name of the schema.
- Execution Time (%): Percentage of time required to execute the application.
- CPU (%): Percentage of CPU utilization.
- I/O (%): Percentage of I/O utilization.
- No. of Tables: Displays the number of tables in the schema.
- Unique Queries (Text): Displays the number of unique queries.
Users
Displays a list of users along with the execution time, total number of queries, unique queries and so on.
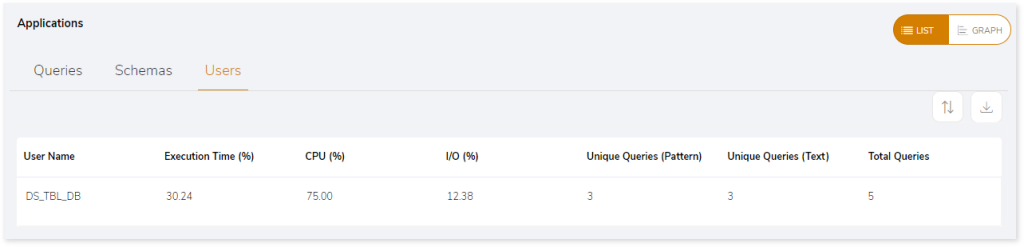
- User Name: Name of the user.
- Execution Time (%): Percentage of time required to execute the application.
- CPU (%): Percentage of CPU utilization.
- I/O (%): Percentage of I/O utilization.
- Unique Queries (Pattern): Displays the number of unique pattern queries. Unique pattern queries identify the distinct query structures, but the query structure’s values may change.
- Unique Queries (Text): Displays the number of unique queries. In Unique Queries (Text), the duplicate queries are eliminated, and solitary queries are identified.
- Total Queries: Displays the total number of queries.
The GRAPH section illustrates a detailed analysis of all applications. It displays the graphical view of execution time required for the application, CPU, and I/O utilization of applications and so on.
Users
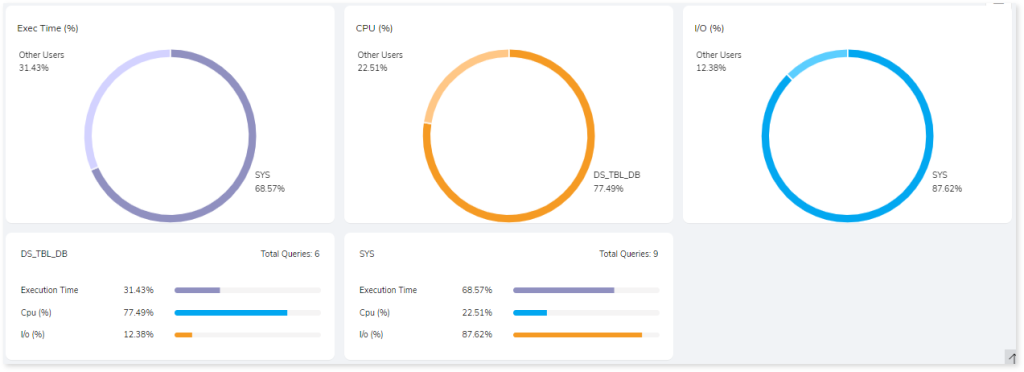
This section provides a summary for all the users comprising of execution time required for the users, CPU, and I/O utilization of users and so on.
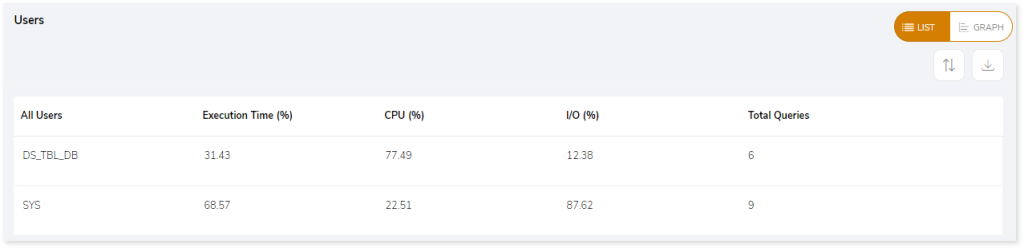
- All Users: Displays a list of all users.
- Execution Time (%): Provides the execution time for users in percentage.
- CPU (%): Percentage of CPU utilization.
- I/O (%): Percentage of I/O utilization.
- Total Queries: Provides the total number of queries.
Browse through each user to get more insights regarding the associated schemas and applications.
Schemas
This section provides details about the schemas associated with the users.
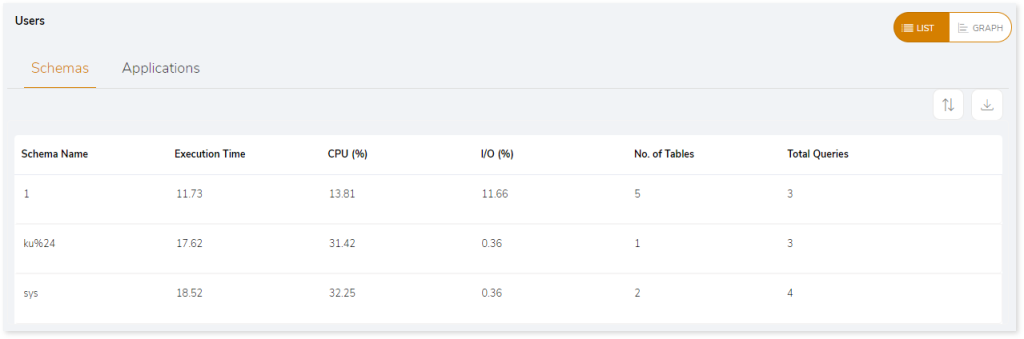
- Schema Name: Name of the schema.
- Execution Time: Time required for the execution.
- CPU (%): Percentage of CPU utilization.
- I/O (%): Percentage of I/O utilization.
- No. of Tables: Provides the number of tables.
- Total Queries: Provides the total number of queries.
Applications
This section provides details about the applications associated with the users.
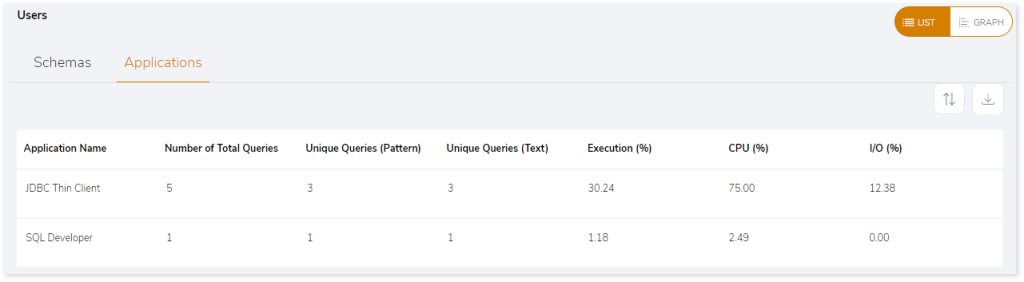
- Application Name: Name of the application.
- Number of Total Queries: Displays the total number of queries.
- Unique Queries (Pattern): Displays the number of unique pattern queries. Unique pattern queries identify the distinct query structures, but the query structure’s values may change.
- Unique Queries (Text): Displays the number of unique queries. In Unique Queries (Text), the duplicate queries are eliminated, and solitary queries are identified.
- Execution (%): Provides the execution time for application in percentage.
- CPU (%): Percentage of CPU utilization.
- I/O (%): Percentage of I/O utilization.
The GRAPH section illustrates a detailed analysis of all applications. It displays the graphical view of execution time required for the users, CPU, and I/O utilization of users and so on.
Files
This section provides a comprehensive report of the source files with information about the total number of files, complexity, and queries associated with each file.
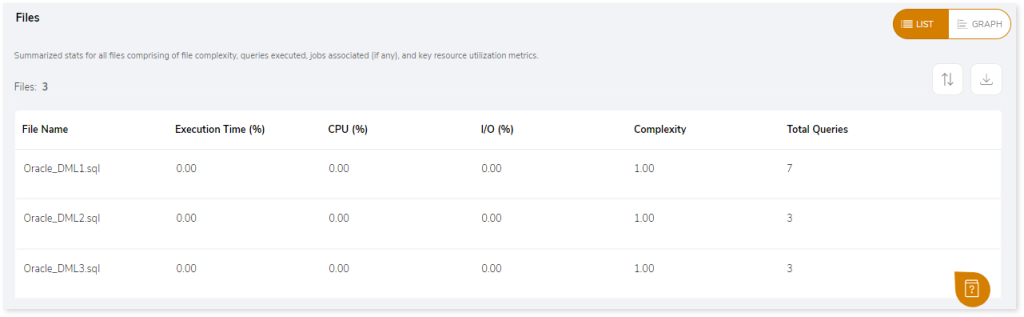
Click the preferred File Name row to gain more insights into the queries present in each file. Here, the queries are categorized into used queries and unused queries.
- Unique (Text): Duplicate queries are eliminated, and solitary queries are identified.
- Used Queries: Displays the number of queries that are used in both DML scripts and Execution logs.
- Unused Queries: Displays the number of queries that are used in DML scripts but not in Execution logs.
- Schema Name: Name of the schema.
- Complexity: Provides the complexity of queries.
- Execution Frequency: Provides the frequency of execution.
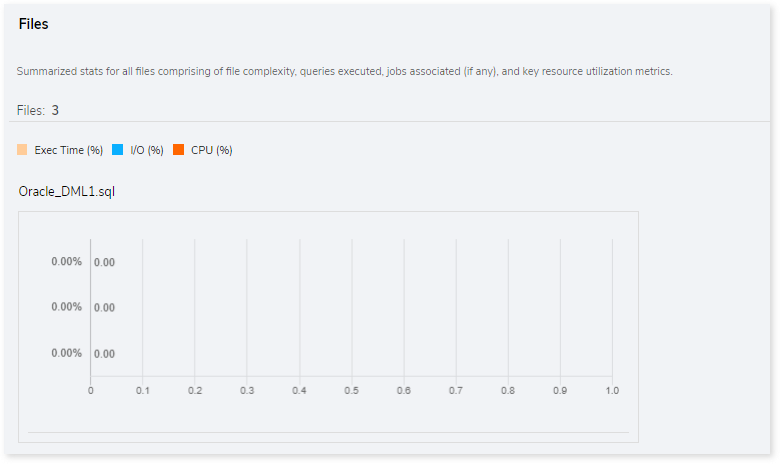
The GRAPH section displays the graphical view of files comprising execution time (%), I/O (%), and CPU (%).
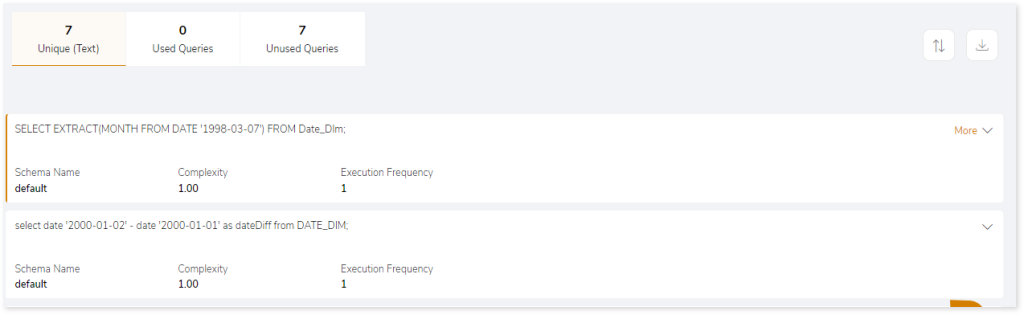
Queries
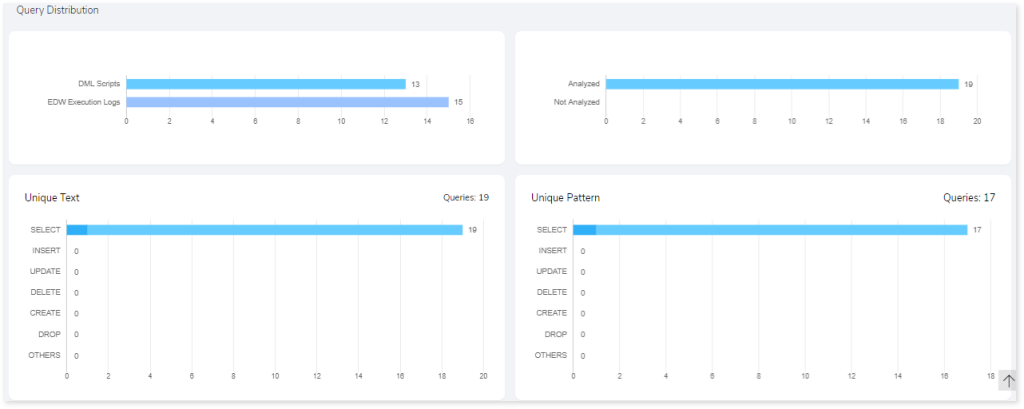
This page displays graphical (GRAPH) and detailed (LIST) analysis of unique and analyzed queries from the total input queries after considering the different SLAs. Moreover, it presents details about the unique query text, unique query patterns, and analyzed and not analyzed queries.
Unique (Text)
This section displays a list of all the unique queries. Additionally, it shows the total number of unique queries and the number of queries segregated by the statement type. In Unique (Text), the duplicate queries are eliminated, and solitary queries are identified.
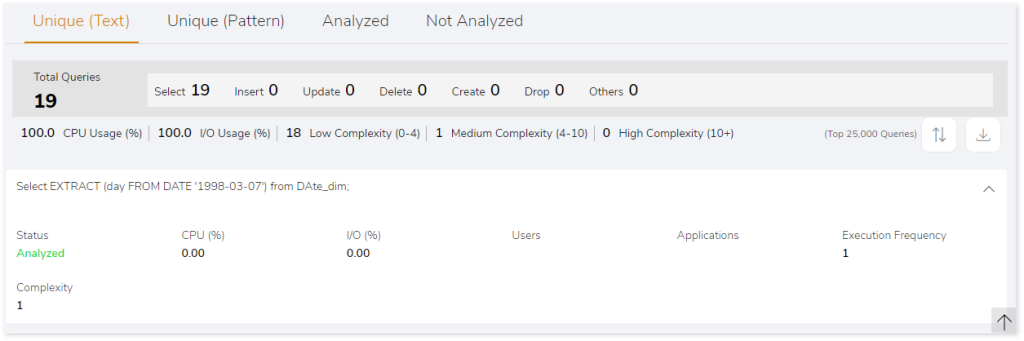
- Status: Displays the query analysis status as Analyzed or Not Analyzed.
- Analyzed: Indicates the query is analyzed.
- Not Analyzed: Indicates the query is not analyzed due to some impediments. If the query status is not analyzed, then it displays the reason for failure.
- CPU (%): CPU utilization percentage.
- I/O (%): I/O utilization percentage.
- Users: Displays users’ information.
- Applications: Displays application details.
- Execution Frequency: Provides the frequency of execution.
- Complexity: Displays the query complexity.
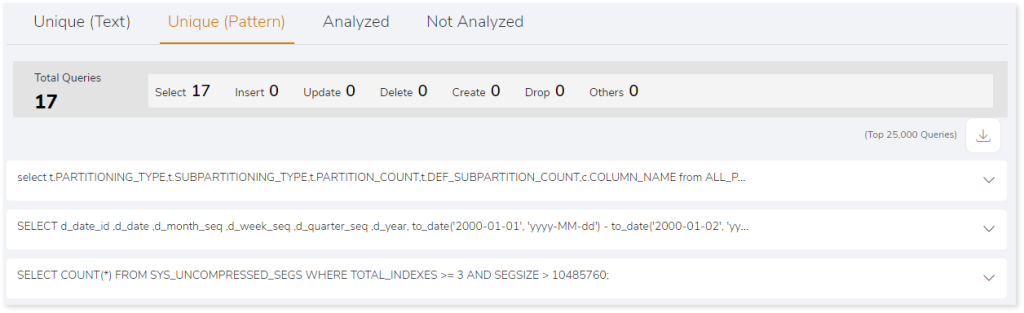
Unique (Pattern)
This section displays a list of all queries with unique patterns. Additionally, it shows the total number of unique pattern queries and the number of queries segregated by the statement type. Unique pattern queries identify the distinct query structures, but the query structure’s values may change.
Analyzed
This section displays a list of all queries that meet the analysis criteria. Additionally, it shows the total number of analyzed queries and the number of queries segregated by statement type.
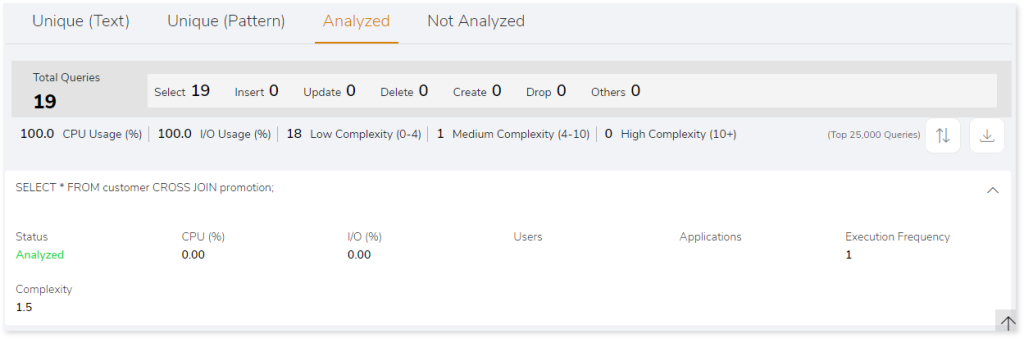
- Status: Displays the query analysis status as Analyzed or Not Analyzed.
- Analyzed: Indicates the query is analyzed.
- Not Analyzed: Indicates the query is not analyzed due to some impediments. If the query status is not analyzed, then it displays the reason for failure.
- CPU (%): CPU utilization percentage.
- I/O (%): I/O utilization percentage.
- Users: Displays users’ information.
- Applications: Displays applications’ details.
- Execution Frequency: Provides the frequency of execution.
- Complexity: Displays the query complexity.
Not Analyzed
This section displays a list of all queries that did not meet the analysis criteria. Additionally, it shows the total number of not analyzed queries as well as the number of queries segregated by statement type.
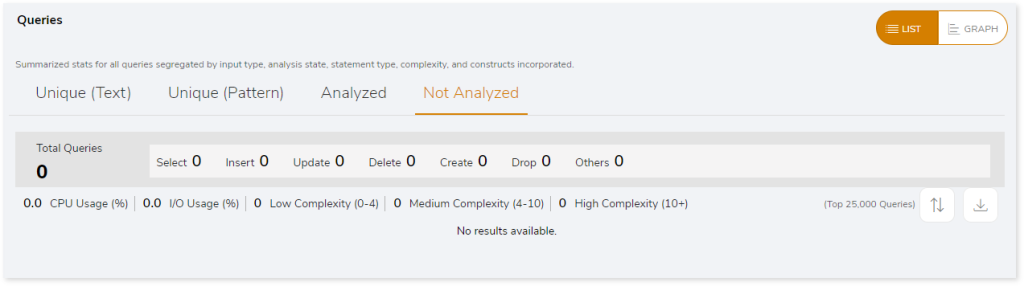
- Status: Displays the query analysis status as Analyzed or Not Analyzed.
- Analyzed: Indicates the query is analyzed.
- Not Analyzed: Indicates the query is not analyzed due to some impediments. If the query status is not analyzed, then it displays the reason for failure.
- CPU (%): CPU utilization percentage.
- I/O (%): I/O utilization percentage.
- Users: Displays users’ information.
- Applications: Displays application details.
- Execution Frequency: Provides the frequency of execution.
- Failure Message: Displays the error message.
The GRAPH section illustrates a detailed analysis of all queries. It demonstrates query distributions based on unique text, unique pattern, analyzed and non-analyzed queries, etc.
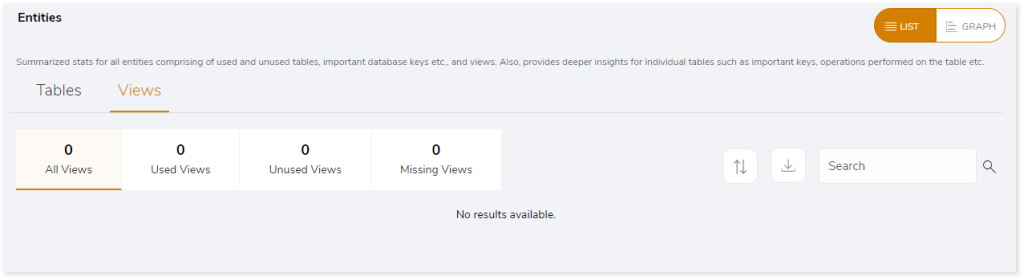
Entities
This section displays graphical (GRAPH) and detailed analysis (LIST) for the analyzed entities based on the frequency of use and provides information about all the available tables and views used in the queries. Entities are:
- Tables: Encapsulates information about All Tables, Used Tables, Unused Tables, and Missing Tables.
- Views: Contributes information about All Views, Used Views, Unused Views, and Missing Views.
Tables
Encapsulates information about All Tables, Used Tables, Unused Tables, and Missing Tables.
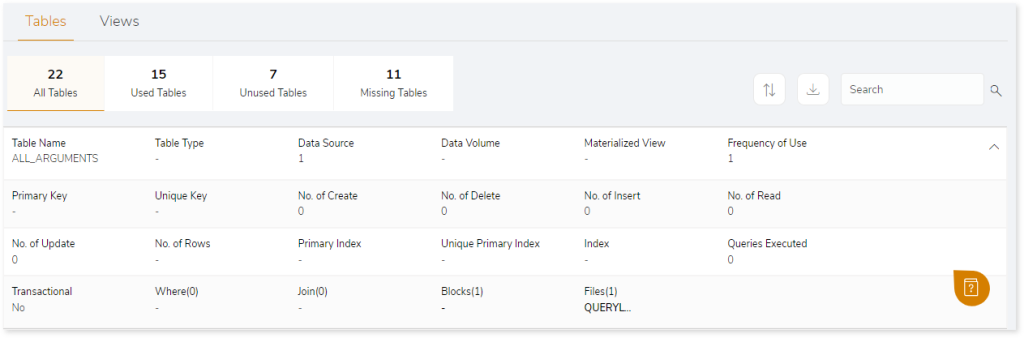
- Table Name: Name of the table.
- Table Type: Type of the table.
- Data Source: Displays details of the data source.
- Data Volume: Displays the quantity of data.
- Materialized View: These are queries used to store data in the physical tables where you can define to update the table automatically when changes are made in the source tables or execute a command to update the tables.
- Frequency of Use: Displays the frequency of table used.
- Primary Key: To identify unique row in the table. It will not accept NULL values.
- Unique Key: To identify records in a table.
- No. of Create: Displays number of CREATE queries in the table.
- No. of Delete: Displays number of DELETE queries in the table.
- No. of Insert: Displays number of INSERT queries in the table.
- No. of Read: Displays number of READ queries in the table.
- No. of Update: Displays number of UPDATE queries in the table.
- No. of Rows: Displays number of rows in the table.
- Primary Index: Indexes based on the primary key.
- Unique Primary Index: Contains unique values in the column of the index table.
- Index: Indexes are lookup tables that help to quickly retrieve data from the database.
- Queries Executed: Number of queries that are executed.
- Transactional: Displays the number of data flow components that are used to perform sorting, merging, data cleansing and so on.
- Where: Displays number of Where clause.
- Join: Displays number of Joins.
- Blocks: Displays number of blocks.
- Files: Displays the name of the associated file.
Views
Contributes information about All Views, Used Views, Unused Views, and Missing Views.
- View Name: Name of the view.
- Data Source: Displays details of the data source.
- Frequency of Use: Displays the frequency of views used.
- No. of Create: Displays number of CREATE queries in the table.
- No. of Delete: Displays number of DELETE queries in the table.
- No. of Insert: Displays number of INSERT queries in the table.
- No. of Read: Displays number of READ queries in the table.
- No. of Update: Displays number of UPDATE queries in the table.
- Queries Executed: Number of queries that are executed.
- Where: Displays number of Where clause.
- Join: Displays number of Joins.
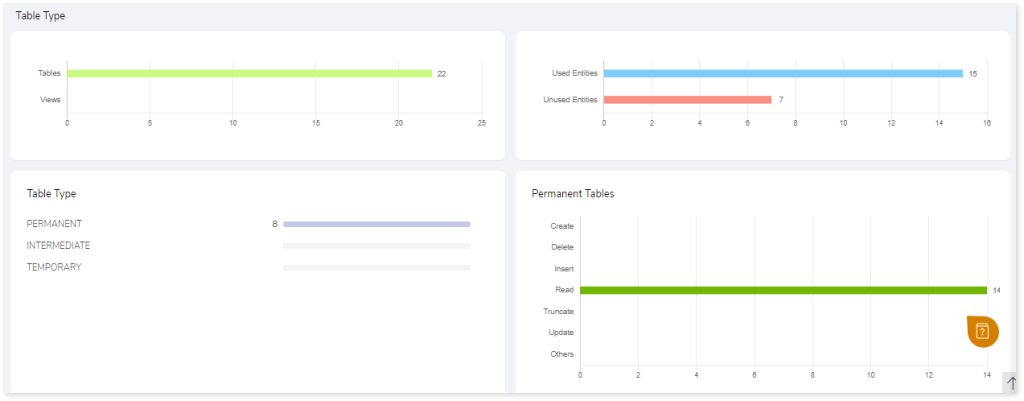
The GRAPH of entities displays a graphical illustration of detailed entity analysis after considering different SLAs. In this visual summary, you can see the distribution of tables, views, and entities, as well as information about Permanent, Temporary, or Intermediate table types.
Artifacts
This section gives details about artifacts (collections of related server data). Artifact types are:
- Missing Artifacts: When artifacts are absent or not recognized in a configured assessment, or a dependency cannot be recognized, they are considered missing artifacts.
- Additional Artifacts: Artifacts that do not have a reference in the input artifacts are referred to as additional artifacts.
- Unparsed Artifacts: Unparsed artifacts are artifacts that are unable to be parsed by the engine.
Missing Artifacts
This section provides the details of all the missing artifacts. Additionally, this section categorizes the missing artifacts into files and entities that are missing.
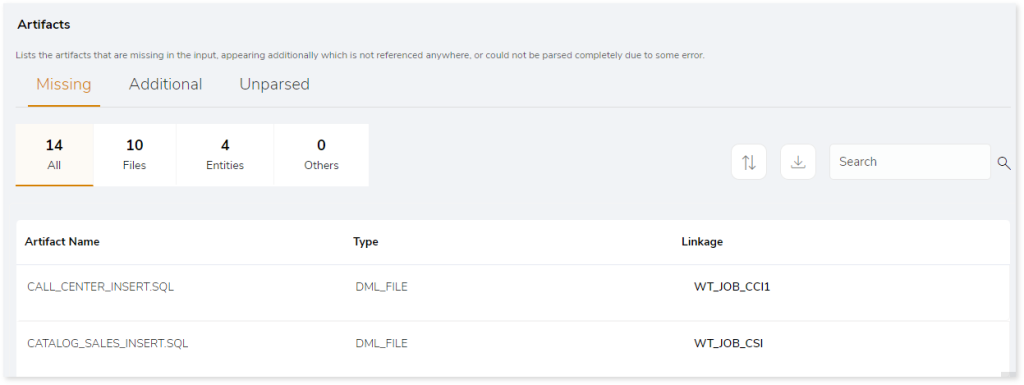
- Artifact Name: Name of the artifact.
- Type: Provides the artifact type such as a file, table, view etc.
- Linkage: Provides the linked or associated file names.
Additional Artifacts
This section provides the details of all the artifacts that appear additionally. It also categorizes the additional artifacts into files and entities that appeared additionally.
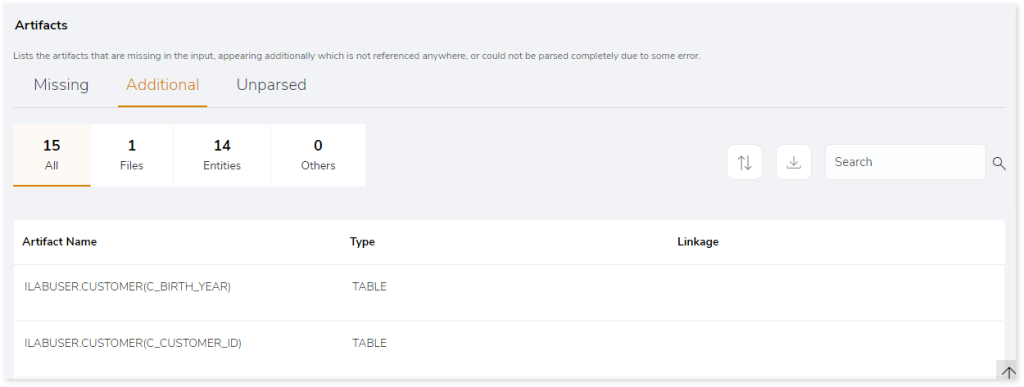
- Artifact Name: Name of the artifact.
- Type: Provides the artifact type such as a file, table, view etc.
- Linkage: Provides the linked or associated file names.
Unparsed Artifacts
This section provides the details of all the artifacts that could not be parsed completely due to some error.
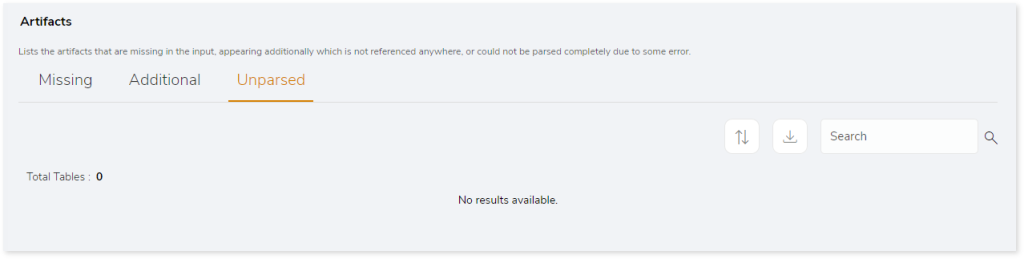
- File Name: Name of the file on which the unparsed query is present.
- Type: Type of the file.
- Error on Line Number: Displays the line number that contains the error.