SAS Assessment Report
This topic contains information about the SAS assessment report. SAS is one of the most popular analytics systems used in the industry. The assessment assesses workloads and produces in-depth insights that help to plan the migration. The input formats for the SAS assessment are SAS or EGP files.
In This Topic:
Highlights
The highlights section gives you a high-level overview of your assessment summary of the analytics performed on the selected workloads. It includes a graphical depiction of the complexity of files as well as the summary of the files used.
Summary
This section illustrates the SAS based analytical scripts that were analyzed across the various elements. It provides details such as the number of files, macros, data steps, the percentage of code analyzed successfully, duplicity-related information, and more.
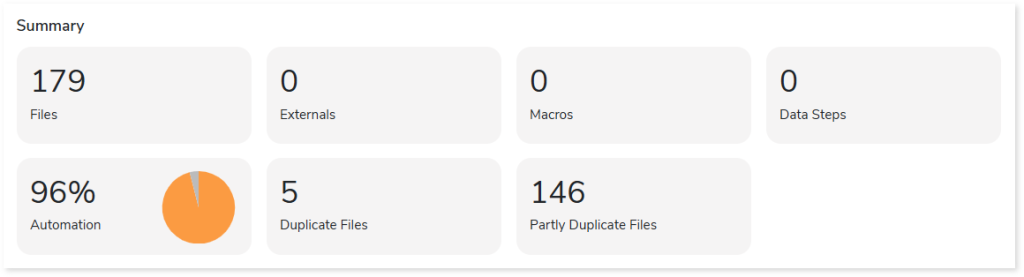
- Files: Displays the total number of input files.
- Externals: Displays the number of external files.
- Macros: Displays the number of macros.
- Data Steps: Displays the number of data steps.
- Automation: Displays the anticipated automation conversion percentage.
- Duplicate Files: Displays the number of duplicate files present in the input files.
- Partly Duplicate Files: Displays the number of partially duplicate files present in the input files.
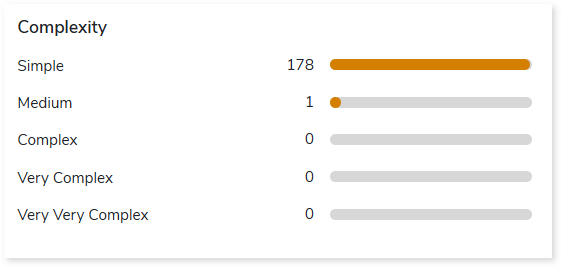
Complexity
This section provides a summarized graphical representation of the complexity of SAS scripts that helps in making different decisions, including budget estimation. The complexity of the SAS script is calculated based on various parameters like external access, conditional procedural statement, external resources, total SQL statement, and procedures.
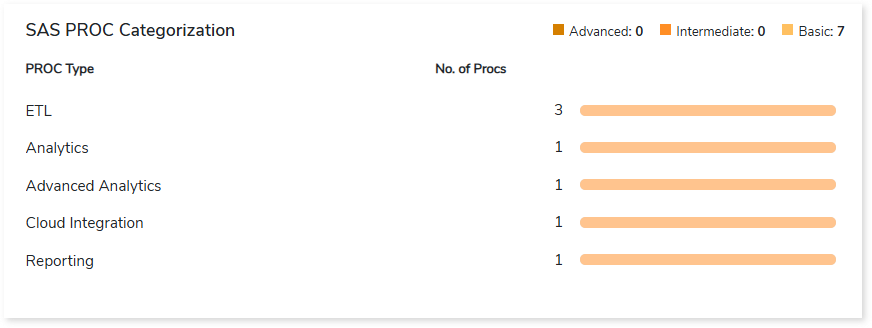
SAS PROC Categorization
This section provides an overview of different types of SAS PROCs, categorized as basic, intermediate, and advanced depending on their level of sophistication.
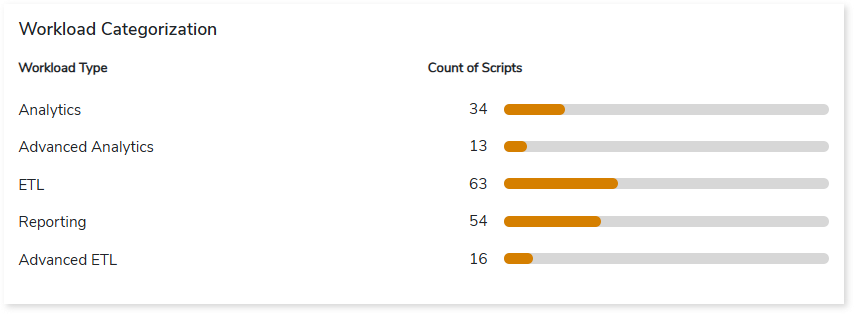
Workload Categorization
This section provides information about the categorization of SAS code based on the workload types such as ETL, analytics, reporting, etc.
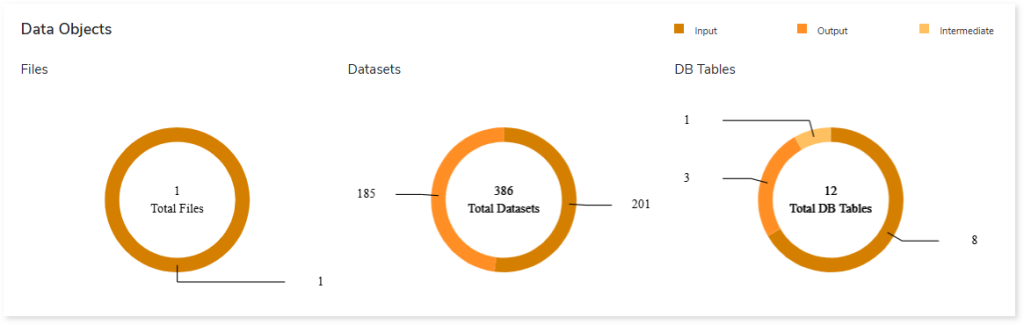
Data Objects
This section provides an overview of total files, datasets, and database tables along with their categorization.
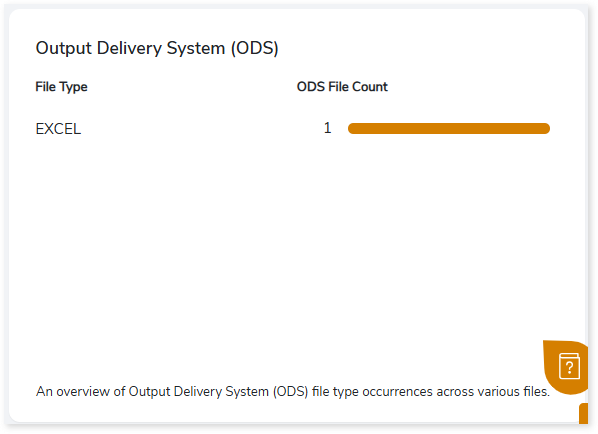
Output Delivery System (ODS)
This section provides an overview of the Output Delivery System (ODS) file type, including its occurrences across various files.
Analysis
This topic provides a detailed examination of source files and artifacts.
Source Analysis
This section provides a comprehensive report of the SAS script including file complexity, queries executed, and so on. It also shows the number of macros, proc SQL, data steps, etc. for every SAS script.
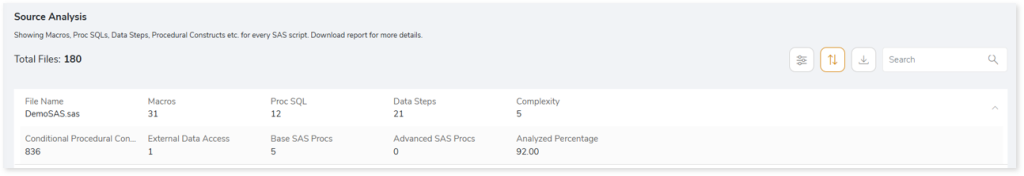
- File Name: Name of the file.
- Macros: Displays the number of macros in the file.
- Proc SQL: Displays the number of Proc SQL in the file.
- Data Steps: Set of instructions to manage (create or modify) data sets.
- Complexity: Displays the complexity of SAS script.
- Conditional Procedural Constructs: Group of conditional statements including do loop statement count, if statement count, where statement count, do over statements count, array statement count, let statement count, put statement count, symdel statement count, and else_cond count.
- External Data Access: Group of statements including lib name statement count, and ods count.
- Base SAS Procs: Procedural statements in SAS including proc append count, proc calendar count, proc catalog count, proc chart count, etc.
- Advanced SAS Procs: Procedural statements in SAS including proc access count, proc aggregation count, proc allele count, proc anom count, proc appsrv count, and more.
- Analyzed Percentage: Percentage of analyzed files.
Artifacts
This page gives details about artifacts-collections of related server data. It provides a list of files that could not be parsed completely due to some error.
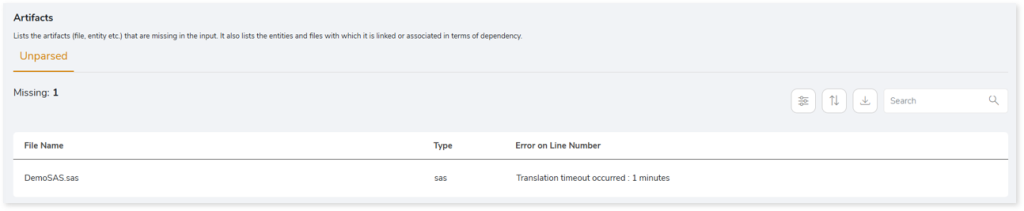
- File Name: Displays the name of the unparsed file.
- Type: Displays the type of each file.
- Error on Line Number: Displays the line number where the error occurred or the error details.
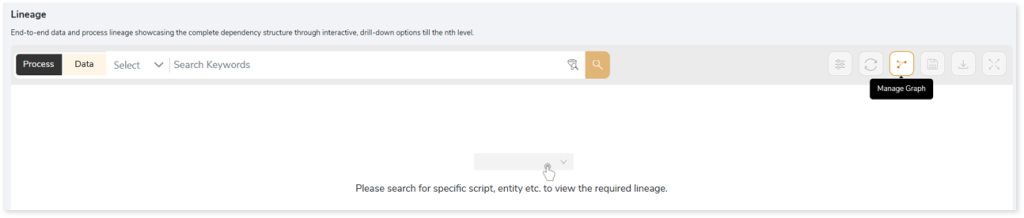
Lineage
End-to-end process lineage identify the complete dependency structure through interactive and drill-down options to the last level.
Typically, even within one line of business, multiple data sources, entry points, ETL tools, and orchestration mechanisms exist. Decoding this complex data web and translating it into a simple visual flow can be extremely challenging during large-scale modernization programs. The visual lineage graph adds tremendous value and helps define the roadmap to the modern data architecture. It deep dives into all the existing flows and provides integrated insights. These insights help data teams make strategic decisions with greater accuracy and completeness. Enterprises can proactively leverage integrated analysis to mitigate the risks associated with migration and avoid business disruption.
LeapLogic’s lineage helps to trace the complete data flow in steps. The visual representation helps to track how the data hopped and transformed along the way, with details of parameter changes, etc. It provides backward and forward lineage showing the hops and reference points of data lineage with a complete audit trail of the data points of interest. They also help temporarily ignore peripheral, unwanted data points and establish useful correlations between data points to uncover hidden patterns and results. Users can deep dive into certain flows leveraging next-gen features like contextual search, advanced filters according to workload type, an interactive visual interface, graph depth, and more.
Now, let’s see how you can efficiently manage lineage.

To view the required lineage:
- Select either the Process or Data tab.
- Enter the keywords in the Search Keywords field.
- Click the Search icon to generate the lineage.
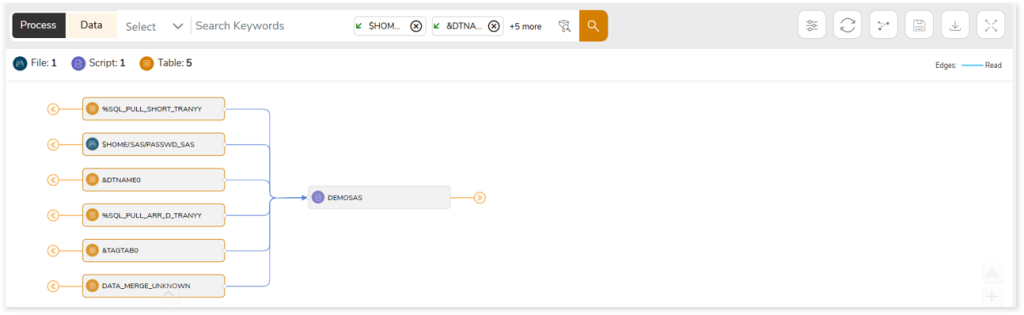
Lineage helps you understand dependencies across processes and data:
- Process lineage illustrates the dependencies between two or more processes such as EGP files, SAS files, etc.
- Data lineage depicts data flow between two or more data-holding components such as entities, flat files, etc.
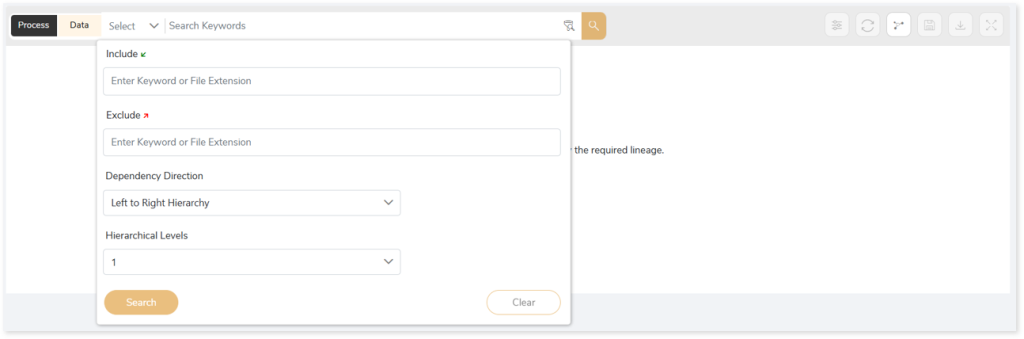
In addition, the filter search icon allows you to include or exclude particular nodes to obtain the required dependency structure. You can also choose the direction of the lineage. By default, the Dependency Direction is Left to Right Hierarchy. You can also choose Right to Left Hierarchy or Bidirectional dependency directions as required. Moreover, you can also increase the Hierarchy Levels to nth level.
Lineage facilitates you visualize how your selected nodes are connected and depend on each other. The nodes and their connecting edges (relationships) help you to understand the overall structure and dependencies.
|
Nodes |
Edges |
 Tables Tables |
 Call Call |
 File File |
 Read Read |
 Stage Stage |
 Execute Execute |
 Bridge Table Bridge Table |
 Write Write |
|
|
 Others Others |
Manage Lineage
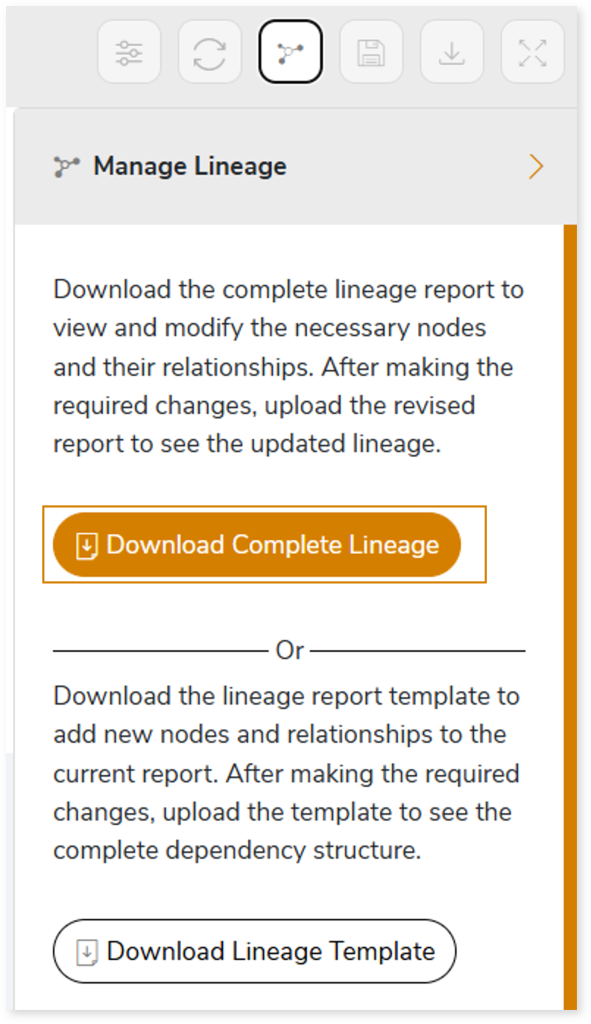
This feature enables you to view and manage your lineage. You can add, modify, or delete nodes and their relationships to generate an accurate representation of the required dependency structure. There are two ways to update the lineage: either using Complete Lineage report or Lineage Template.
Using Complete Lineage report
Follow the below steps to modify the lineage:
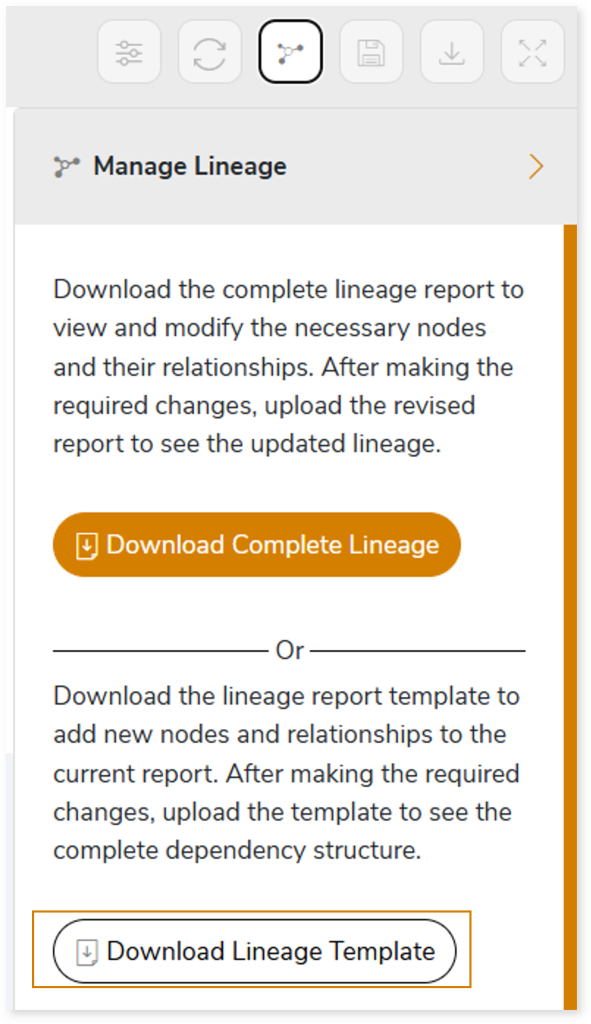
- Click the Manage Graph icon.
- Click Download Complete Lineage to update, add, or delete the nodes and their relationships in the current lineage.
- Once the complete lineage report is downloaded, you can make necessary updates such as updating, deleting or adding the nodes and its relationships.
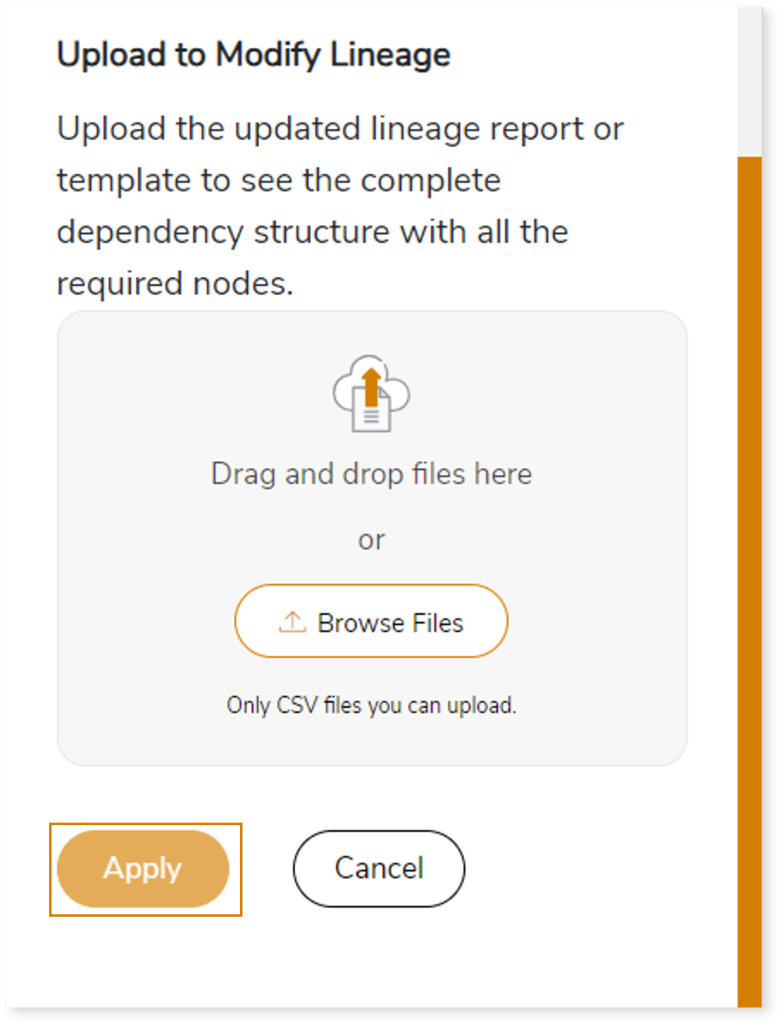
- After making the required changes, upload the updated lineage report in Upload to Modify Lineage.
- Click Apply to incorporate the updates into the dependency structure.
- Generate the required process or data lineage.

Using Lineage Template
Follow the below steps to add new nodes and their relationships to the current lineage report:
- Click the Manage Graph icon.

- Click Download Lineage Template.
- Once the lineage template is downloaded, you can add new nodes and relationships in the template.
- After making the required changes, upload the template in Upload to Modify Lineage.
- Click Apply to incorporate the updates into the complete dependency structure.
- Generate the required process or data lineage.
You can also apply:
| Feature | Icon | Use |
| Filter |  | Used to filter the lineage. |
| Reload Graph |  | Assists in reloading graphs. |
| Manage Graph |  | To view and manage lineage by adding, modifying, or deleting nodes and their relationships to accurately reflect dependency structures. |
| Save |  | Used to save the lineage. |
| Download |  | Used to download the file. |
| Expand |  | Used to enlarge the screen. |
Downloadable Reports
Downloadable reports allow you to export detailed SAS assessment reports of your source data which enables you to gain in-depth insights with ease. To access these assessment reports, click Reports.

Types of Reports
In the Reports section, you can see various types of reports such as Insights and Recommendations, Source Inventory Analysis, and Lineage Report. Each report type offers detailed information allowing you to explore your assessment results.

Insights and Recommendations
This report provides an in-depth insight into the source input files. It contains the final output including information about analyzed SAS scripts, complexity measures, functions, variable references, file duplicacy, and more.
Here, you can see the csv_report and sas folders along with the SAS_Code_Assessment.xlsx and assessment_sas_highlight_db reports.
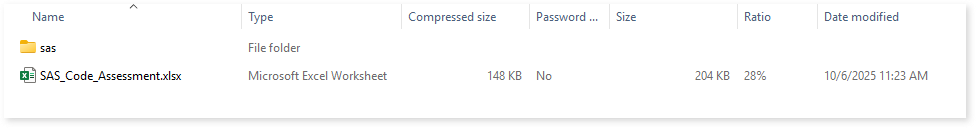
SAS_Code_Assessment.xlsx: This report provides insights about the source inventory. It helps you plan the next frontier of a modern data platform methodically. It includes information about complexity measures, functions, variable references, overall duplicacy, EGP duplicacy, and more.
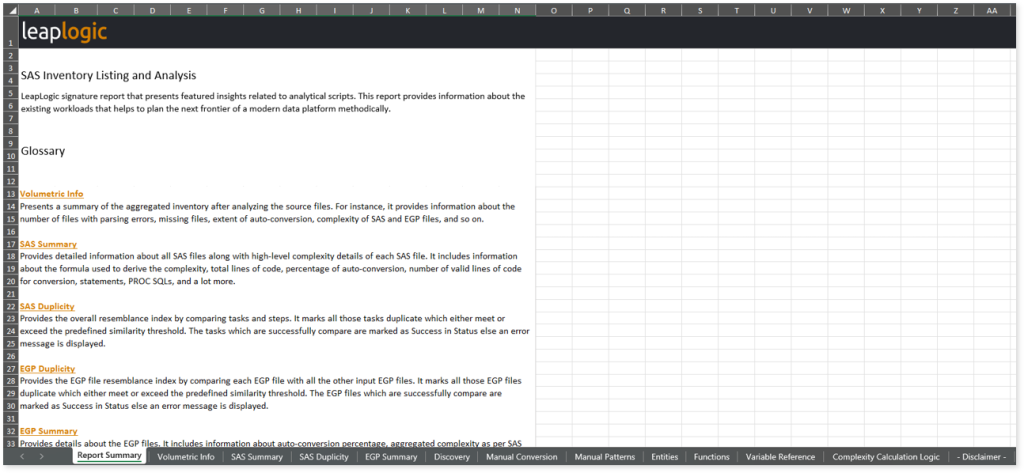
This report contains the following information:
- Report Summary: Provides information about all the generated artifacts.
- Volumetric Info: Presents a summary of the aggregated inventory after analyzing the source files. For instance, it provides information about the number of files with parsing errors, missing files, extent of auto-conversion, complexity of SAS and EGP files, and so on.
- SAS Summary: Provides detailed information about all SAS files along with high-level complexity details of each SAS file. It includes information about the formula used to derive the complexity, total lines of code, percentage of auto-conversion, number of valid lines of code for conversion, statements, PROC SQLs, and a lot more.
- SAS Duplicity: Provides the overall resemblance index by comparing tasks and steps. It marks all those tasks duplicate which either meet or exceed the predefined similarity threshold. The tasks which are successfully compare are marked as Success in Status else an error message is displayed.
- EGP Duplicity: Provides the EGP file resemblance index by comparing each EGP file with all the other input EGP files. It marks all those EGP files duplicate which either meet or exceed the predefined similarity threshold. The EGP files which are successfully compare are marked as Success in Status else an error message is displayed.
- EGP Summary: Provides details about the EGP files. It includes information about auto-conversion percentage, aggregated complexity as per SAS steps, total number of lines of code, number of non-converted code lines, count of PROC SQL statements, complexity, and so on.
- Discovery: Lists key metrics related to auto-converted code. It includes information about code parsing status, percentage of auto-conversion, SAS task types, and likewise.
- Manual Conversion: Provides more granular auto-conversion metrics such as statements like format, date, length, increment, etc., that need manual intervention. It also provides the count of statements, procs, etc., that need manual intervention in the format “ToDo Automatic Comment “.
- Step 1: In the Discovery sheet, if Parsing status are failed consider it for manual conversion.
- Step 2: In the Missing Source Code sheet, if you find an entry there, do not proceed with the manual conversion. We need to first get the missing files from the customer and then do the end-to-end conversion.
- Step 3: In the Manual conversion sheet, if % auto-conversion is more than 20% then ask for code re-conversion and statement-wise count for manual conversion.
- Step 4: In the Manual Patterns sheet, refer to the details of code blocks that need manual conversion.
- Manual Patterns: Provides details of code blocks that need manual conversion. It includes information about the statement types which are not auto-converted, code for manual conversion, partially auto-converted code but requires minor changes, and describes actions required for manual conversion.
- Entities: Lists all the entities existing in the SAS file along with their type, operation type, reference value, and so on.
- Functions: Lists all the functions in the source scripts along with their target equivalent function, conversion strategy, etc.
- Variable Reference: Lists all the variables in a source SAS file along with their value appearing in the code. It also lists the entity types such as macro call, LET, etc.
- Parsing Errors: Provides information about unparsed code.
- Dependent Source Code: Lists dependent files for different source files.
- Complexity Calculation Logic: Provides complete high-level details required for complexity calculations of SAS and EGP files. It includes information about the Group Statements – collection of statements and lists all the SAS base functions. It also provides the complexity range based on an established complexity calculation logic, the assessment engine calculates the complexity of SAS scripts and their components and shows it in a range format for each SAS statement type and function. For .egp files, it provides the definition for the aggregated complexity of the EGP files.
Browse through sas folder to access SAS Analysis DB.xlsx.
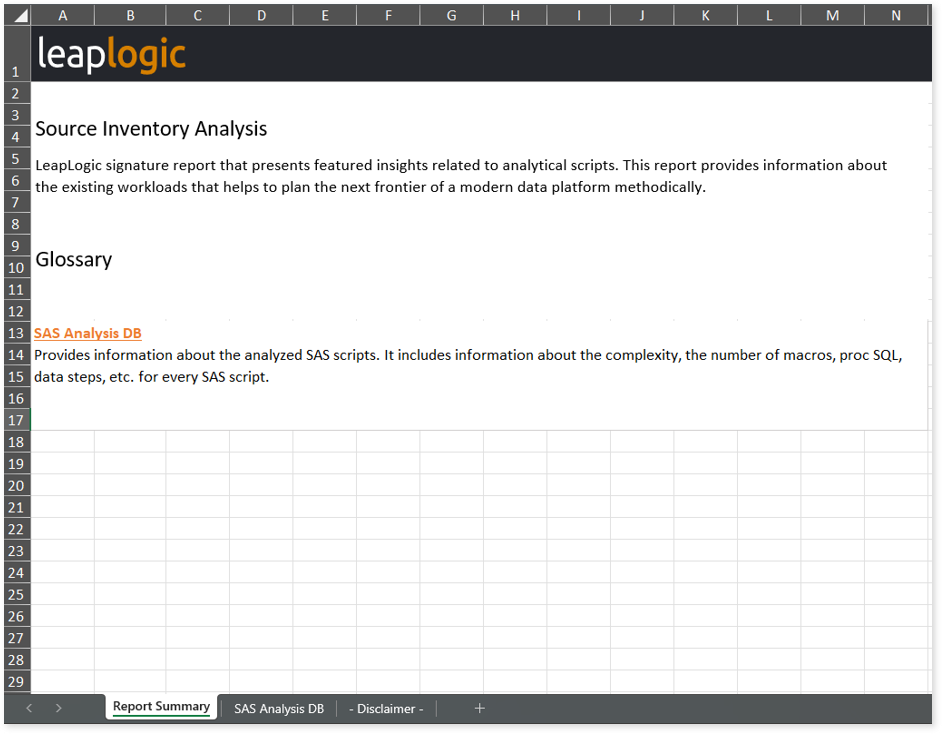
SAS Analysis DB.xlsx: This report provides information about the analyzed SAS scripts.
This report contains the following information:
- Report Summary: Provides information about all the generated artifacts.
- SAS Analysis DB: Provides information about the analyzed SAS scripts. It includes information about the complexity, the number of macros, PROC SQL, data steps, file similarity, etc., for every SAS script.
Source Inventory Analysis
It is an intermediate report which helps to debug failures or calculate the final report.
Browse through analytics > sas > csv_report to access the files ProcedureTypes.csv, SAS_PROC_Frequency.csv, and WorkloadTypes.csv.
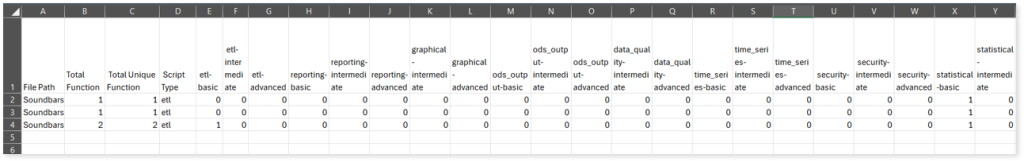
ProcedureTypes.csv: This report provides information about SAS PROC types including the total number of functions, unique functions, their classification based on the level of sophistication, and the corresponding SAS PROCs.
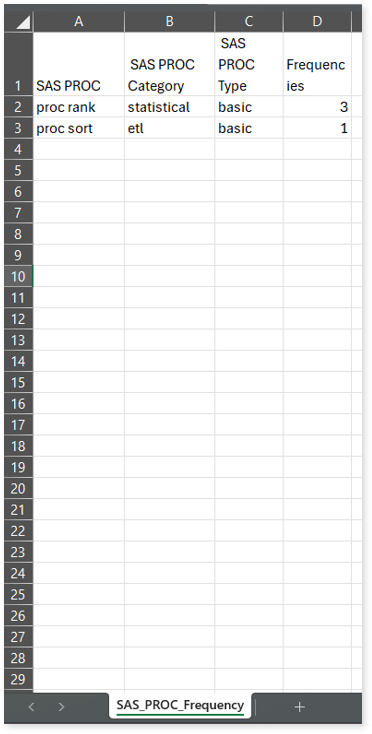
SAS_PROC_Frequency.csv: This report provides information about different SAS PROCs, highlighting their categories (etl, statistical, etc.), classification by type based on the level of sophistication (basic, intermediate, and advanced) and their frequency of occurrence.
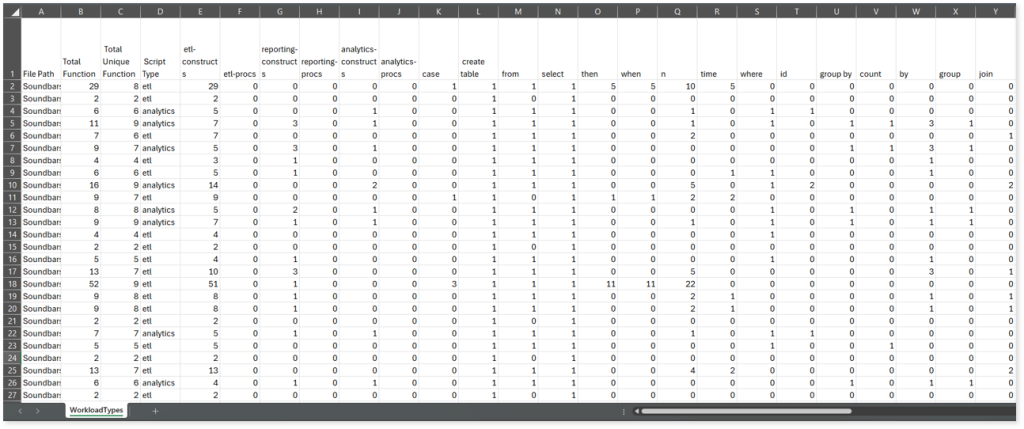
WorkloadTypes.csv: This report shows SAS code categorization based on the workload types such as ETL, analytics, reporting, etc. It includes information about the total number of functions, unique functions, and more.
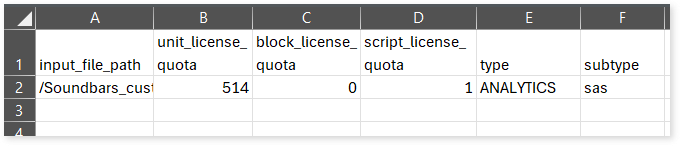
license_quota_info.csv: This report provides information about the license quota deducted in the assessment.
Lineage Report
This report provides complete dependency details for all nodes. It provides an end-to-end data and process lineage that helps to identify the complete dependency structure and the data flow.
This report contains the following information:
- Volumetric Info (Summary): Provides volumetric information about the artifact types such as tables, files, and SAS scripts.
- Nodes: Lists all the source and target nodes along with their type. Each node represents a data object in the lineage making it easier to trace how data is consumed, transformed, and processed across the flow.
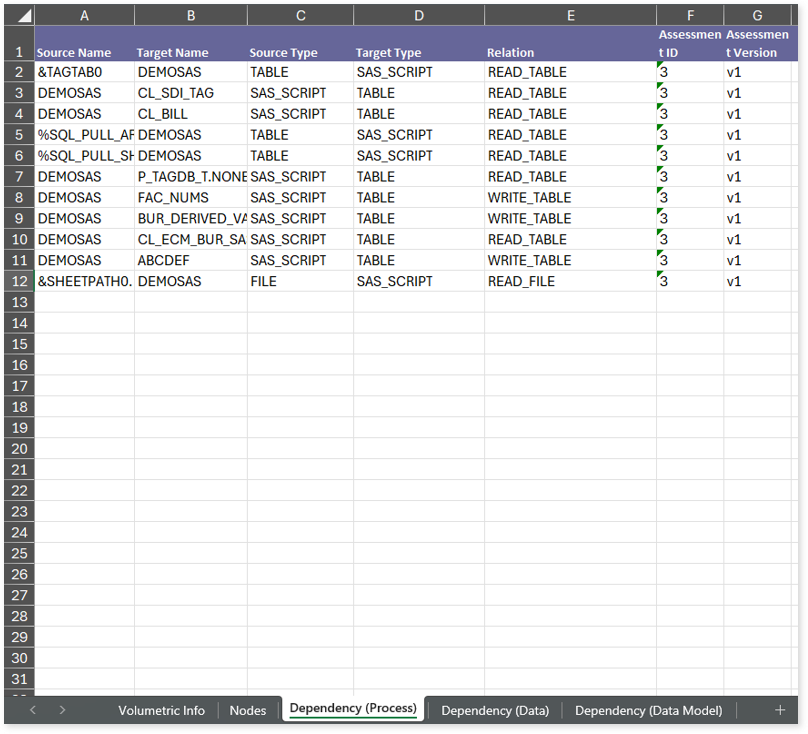
- Dependency (Process): Provides information about the process lineage. It offers detailed visibility into interdependencies between processes—such as EGP files, SAS files, etc.—helping you understand how they are connected within the flow.
- Dependency (Data): Provides information about the data lineage. It captures detailed table-level dependencies, including entities, flat files, etc., offering end-to-end visibility into how data flows and transforms across the flow.
- Dependency (Data Model): Provides dependency details about the data models. It highlights the end-to-end relationships and dependencies between model elements, helping users understand structure and trace linkages.