Data Validation Report
Here you can see the results of data validation applied to the original and target data sources to ensure quality.
In This Topic:
Data Validation: File
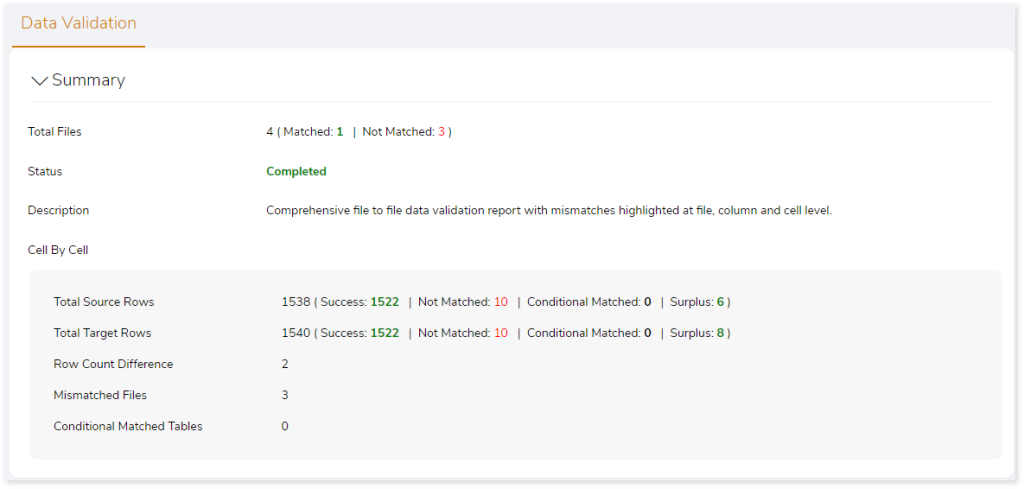
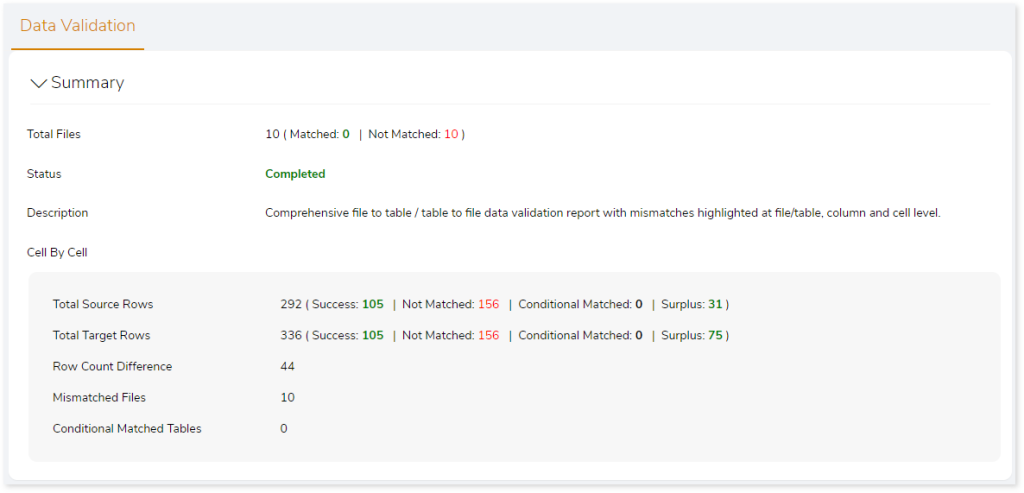
Here you can see a comprehensive file-to-file data validation report with mismatches highlighted at file, column, and cell level. It provides a summary of:
- Total Files: Displays total number of files in Data Validation stage.
- Matched: Displays total number of matched files between the source and target.
- Not Matched: Displays total number of mismatched files between the source and target.
- Status: Provides status of the Data Validation stage.
- Description: Displays a brief description of the stage is displayed.
- Cell By Cell: Displays cell-by-cell comparison details.
- Total Source Rows: Displays the total number of source rows along with success, not matched, conditional matched, and surplus data.
- Success: Displays the number of matched data between source and target.
- Mismatch: Displays the number of mismatched data between source and target.
- Conditional matched: Displays the number of matched data based on the applied conditions between source and target. While configuring data validation you can configure various rules or conditions such as trim, round (), case insensitive, regular expression, etc., for specific tables or columns. For example, in case insensitive rules, the system ignores case sensitivity and recognizes the same value in the source and target.
- Surplus: Displays the number of surplus source data.
- Total Target Rows: Displays the total number of target rows along with the success, not matched, conditional matched, and surplus data.
- Success: Displays the number of matched data between source and target.
- Mismatch: Displays the number of mismatched data between source and target.
- Conditional matched: Displays the number of matched data based on the applied conditions between source and target. While configuring data validation you can configure various rules or conditions such as trim, round (), case insensitive, regular expression, etc., for specific tables or columns. For example, in case insensitive rules, the system ignores case sensitivity and recognizes the same value in the source and target.
- Surplus: Displays the number of surplus target data.
- Row Count Difference: Displays the number of differences between source and target rows.
- Mismatched Files: Displays the number of mismatched files.
- Conditional Matched Tables: Displays the number of matched tables based on the applied conditions.
Functions
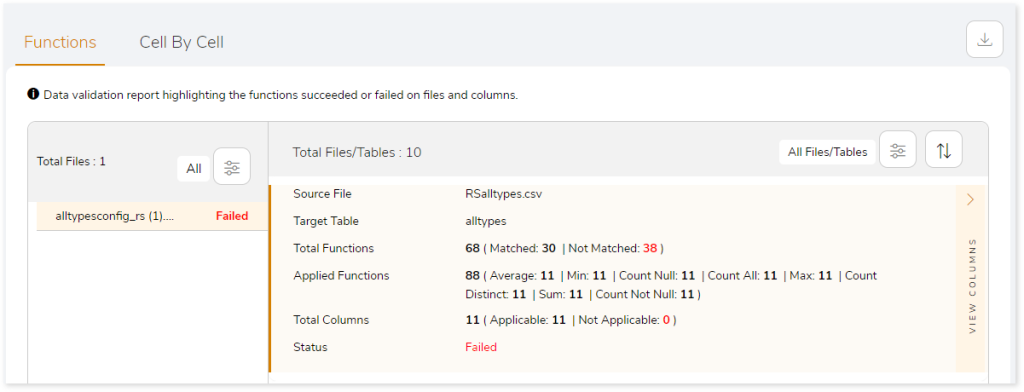
The Functions section shows the validation report highlighting the functions that succeeded or failed on files and columns, including:
- Source File: Name of the source file.
- Target File: Name of the target file.
- Total Functions: Displays the total number of functions used for validation.
- Applied Functions: Displays the aggregate functions used for data validation.
- Total Columns: Displays the number of columns involved in data validation.
- Status: Provides status information.
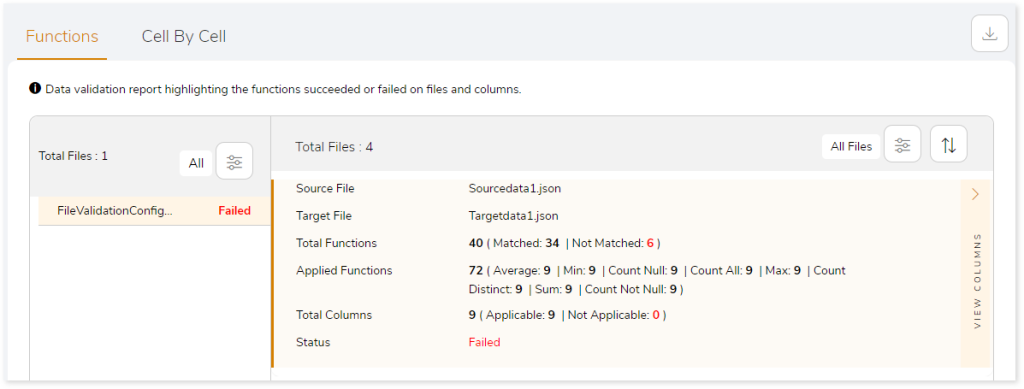
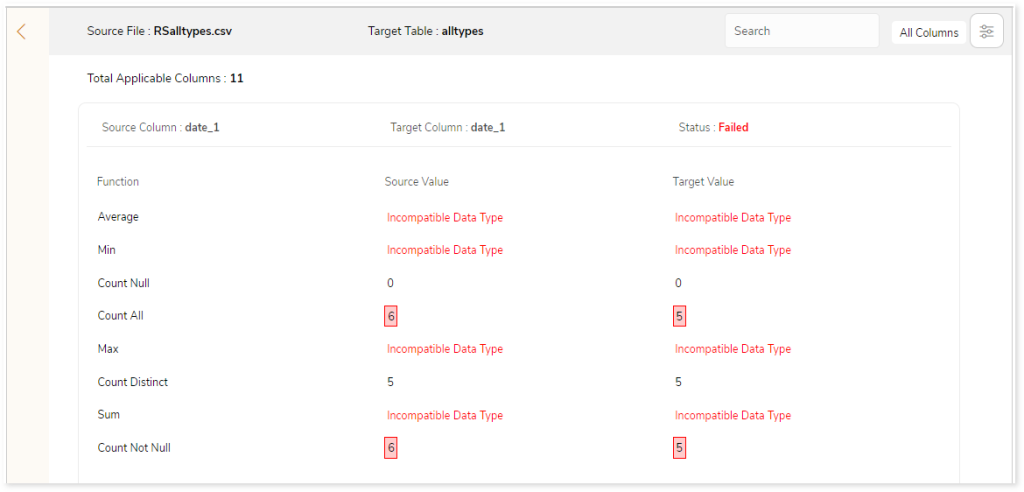
Moreover, a detailed report can be downloaded from the  . Click
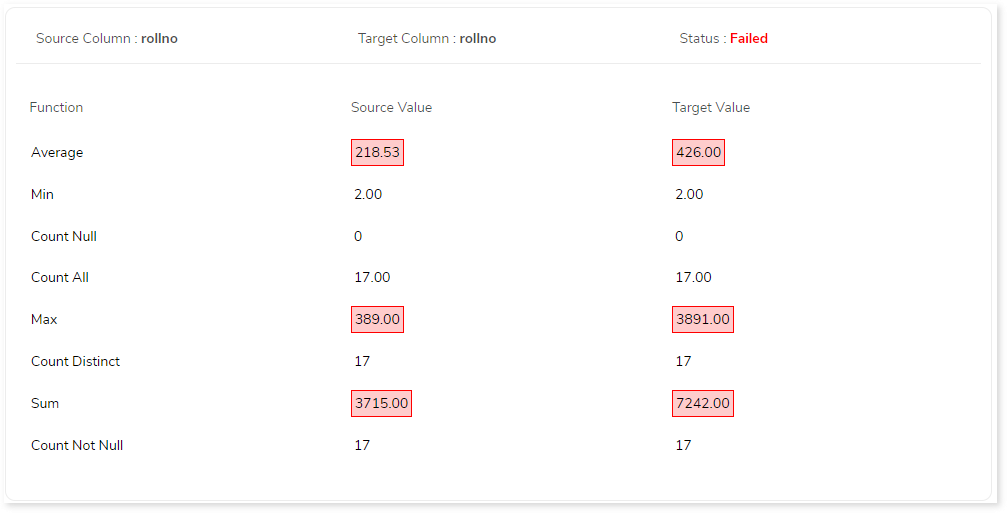
  on the preferred file to get more information about the applied functions on the source and target.
Cell by Cell
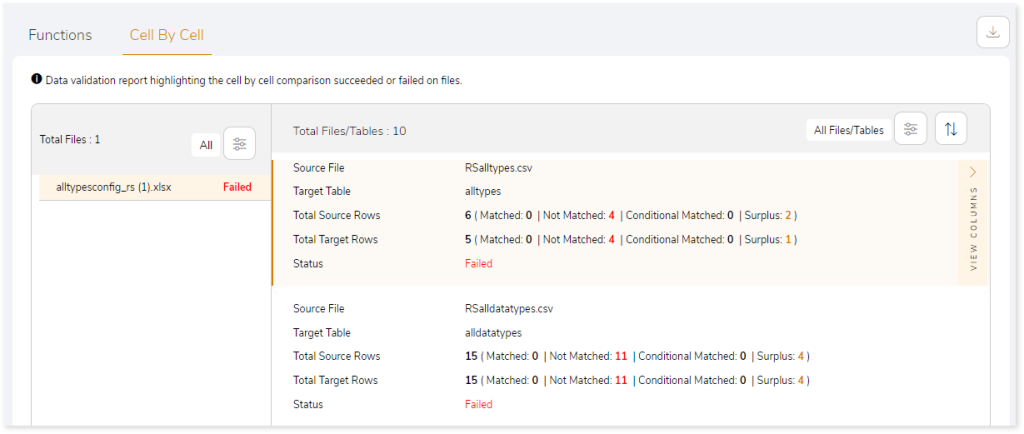
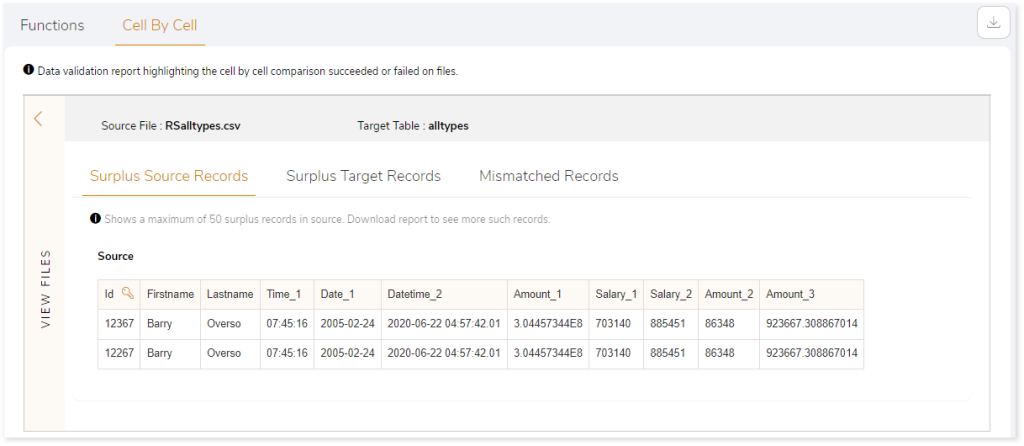
This section highlights the cell-by-cell comparison report. The left panel shows the total files along with the validation status. The right panel shows the respective information. It includes details of the source and target files, total number of source and target rows, and the validation status.
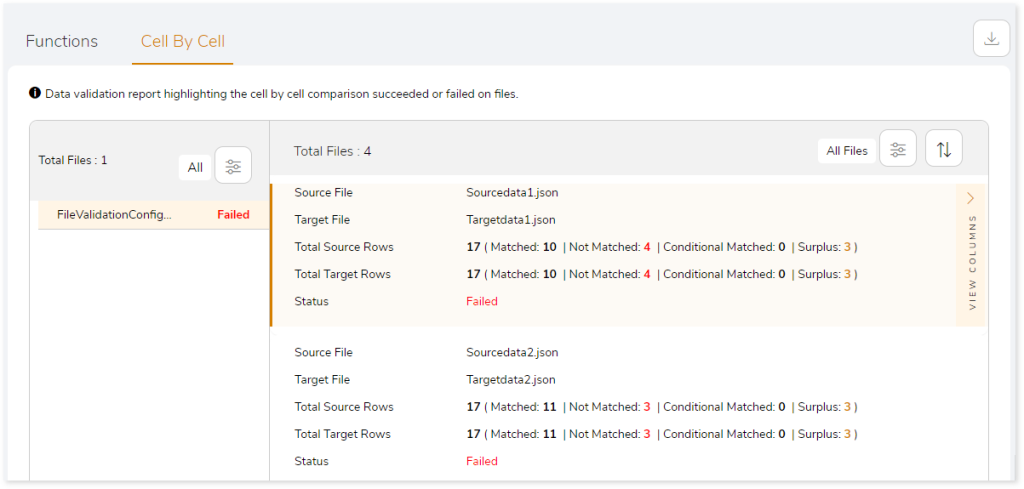
Click to get more insights into surplus source and target records along with mismatched records.
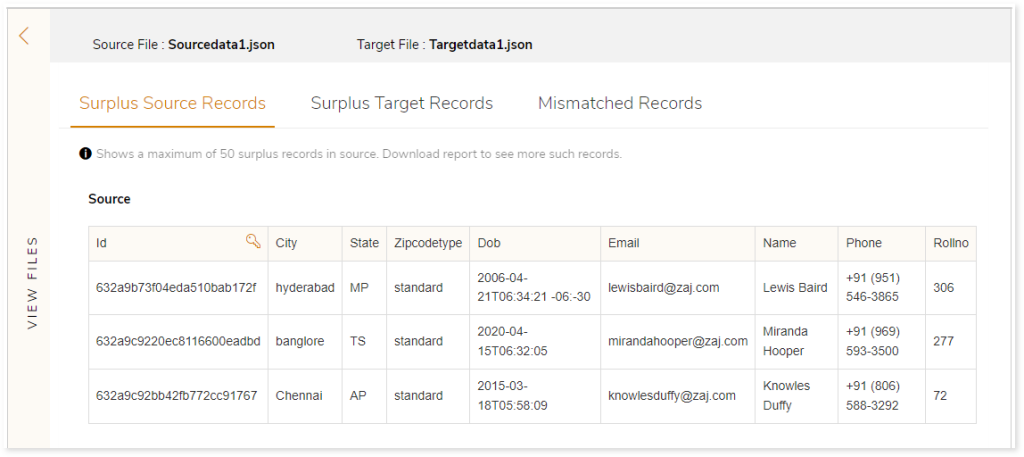
Surplus Source Records displays the surplus records in source. It showcases a maximum of 50 surplus records.
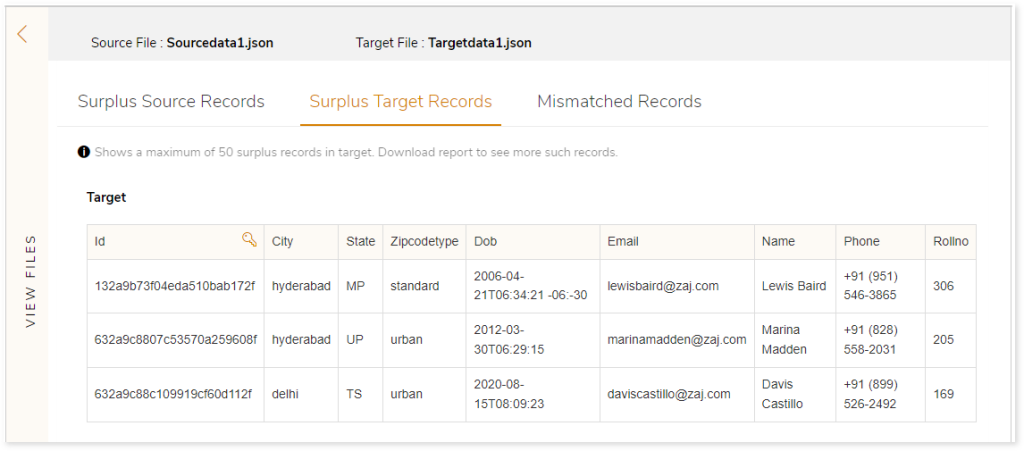
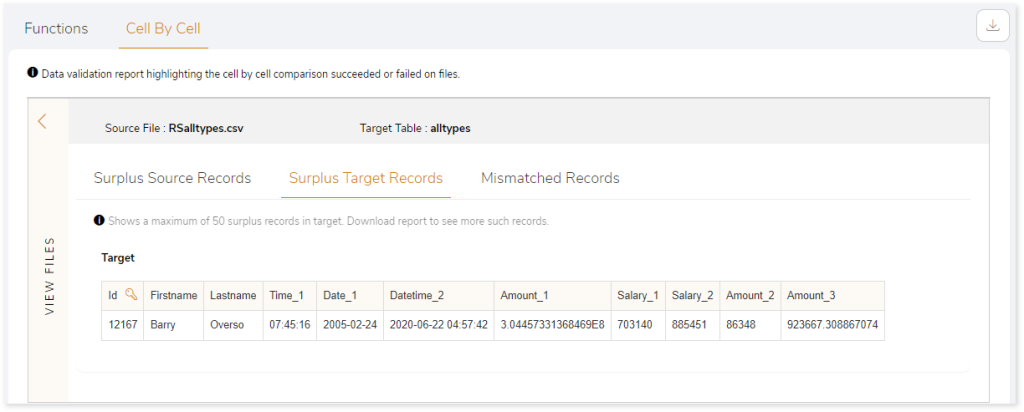
Surplus Target Records displays the surplus records in target. It showcases a maximum of 50 surplus records.
Mismatch Records displays the mismatch data between source and target. It shows a maximum of 50 mismatch records.
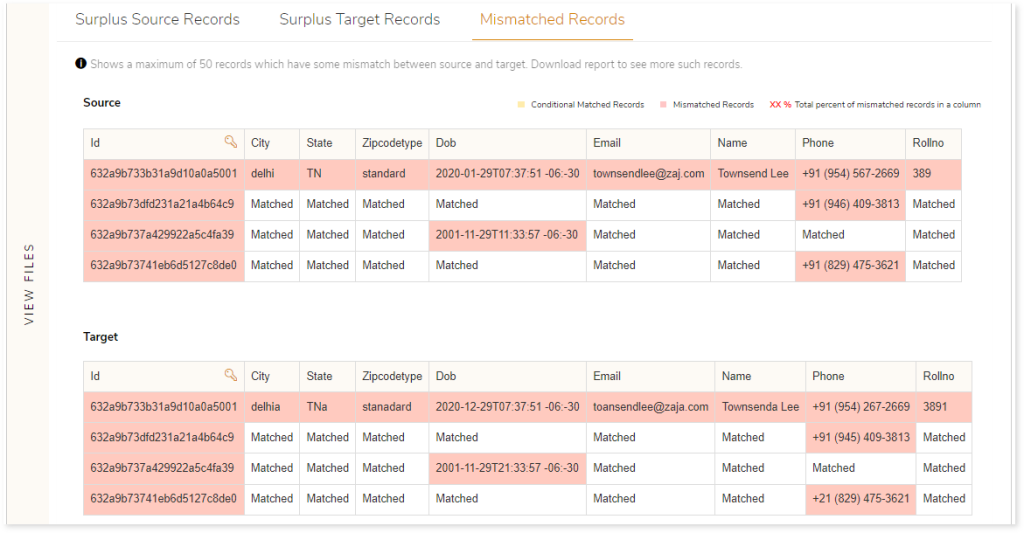
 indicates the mismatched records. Here, the data in the City column on the source and target tables are highlighted as mismatched records because the value do not match. For example: the value in the City column on source is “delhi”, while it is “delhia” on the target. As the value do not match, this cell is marked as “Mismatched Records”.
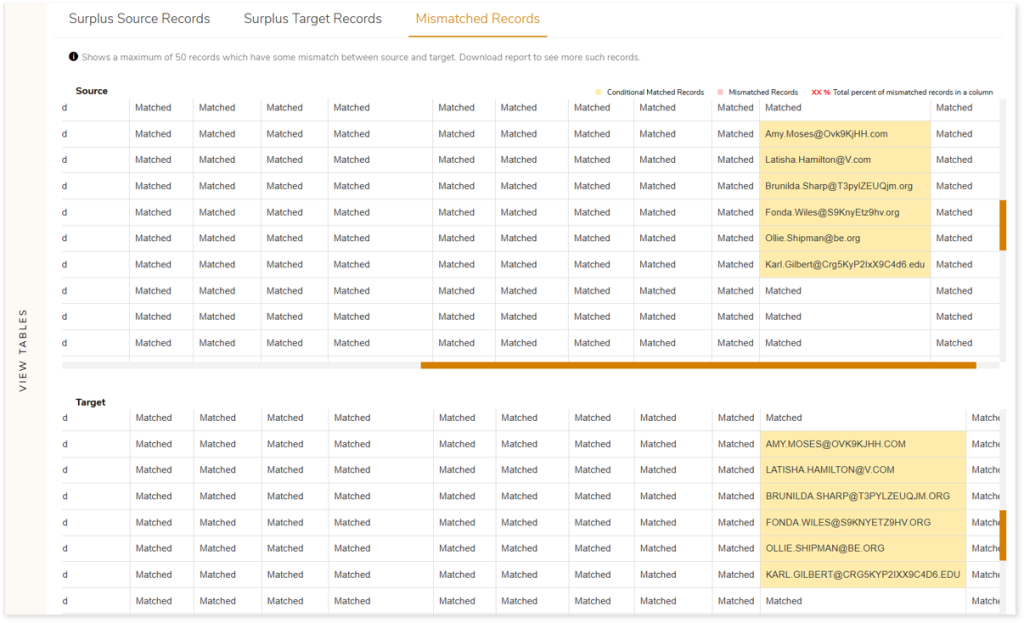
 indicates the matched records based on applied conditions. In the below image, the email addresses are conditionally matched based on the case insensitive rule. In case insensitive rule, the system ignores case sensitivity and recognizes the same value on the source and target tables. For example: the email address present in the source column is “Army.Moses@Ovk9KjHH.com” while in target column is “AMY.MOSES@OVK9KJHH.COM”, this cell is marked as “Conditional Matched Records” because case insensitive rule is applied.
Data Validation: Table
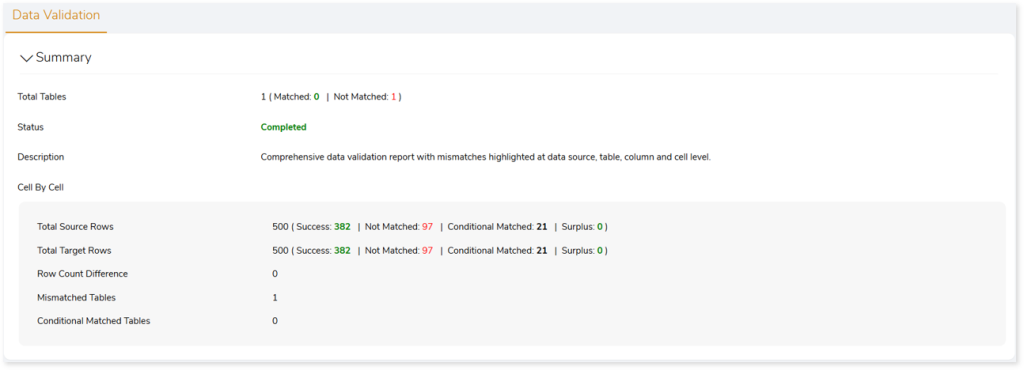
Here you can see a comprehensive table-to-table data validation report with mismatches highlighted at table, column, and cell level. It provides a summary of:
- Total Tables: Total number of tables in the data validation stage.
- Matched: Displays total number of tables that matched between the source and target.
- Not Matched: Displays total number of mismatched tables between the source and target.
- Status: Provides status of the Data Validation stage.
- Description: Displays a brief description of the stage.
- Cell By Cell: Displays the cell-by-cell comparison details.
- Total Source Rows: Displays the total number of source rows along with success, not matched, conditional matched, and surplus data.
- Success: Displays the number of matched data between source and target.
- Mismatch: Displays the number of mismatched data between source and target.
- Conditional matched: Displays the number of matched data based on the applied conditions between source and target. While configuring data validation you can configure various rules or conditions such as trim, round (), case insensitive, regular expression, etc., for specific tables or columns. For example, in case insensitive rules, the system ignores case sensitivity and recognizes the same value in the source and target.
- Surplus: Displays the number of surplus source data.
- Total Target Rows: Displays the total number of target rows along with the success, not matched, conditional matched, and surplus data.
- Success: Displays the number of matched data between source and target.
- Mismatch: Displays the number of mismatched data between source and target.
- Conditional matched: Displays the number of matched data based on the applied conditions between source and target. While configuring data validation you can configure various rules or conditions such as trim, round (), case insensitive, regular expression, etc., for specific tables or columns. For example, in case insensitive rules, the system ignores case sensitivity and recognizes the same value in the source and target.
- Surplus: Displays the number of surplus target data.
- Row Count Difference: Displays the number of differences between source and target rows.
- Mismatched Tables: Displays the number of mismatched tables.
- Conditional Matched Tables: Displays the number of matched tables based on the applied conditions.
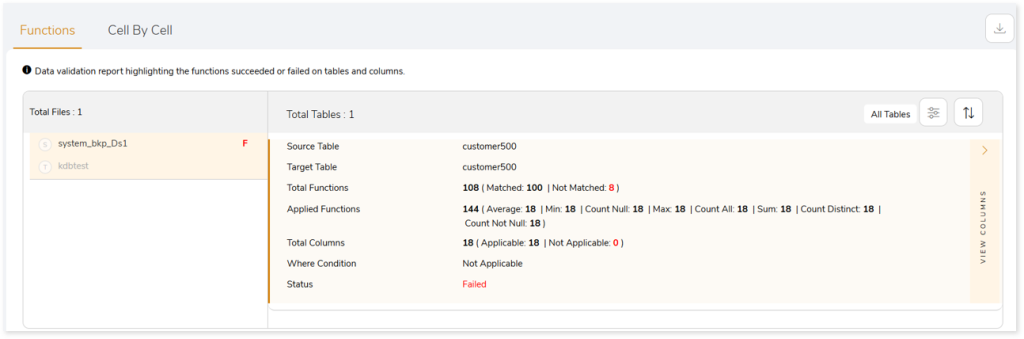
Functions
The Functions section shows the validation report highlighting the functions succeeded or failed on tables and columns, including:
- Source Table: Name of the source table.
- Target Table: Name of the target table.
- Total Functions: Shows the functions used for validation.
- Applied Functions: Displays the aggregate functions used for data validation.
- Total Columns: Displays the number of columns involved in data validation.
- Where Condition: Displays the applied “WHERE” condition.
- Status: Provides validation status of the tables.
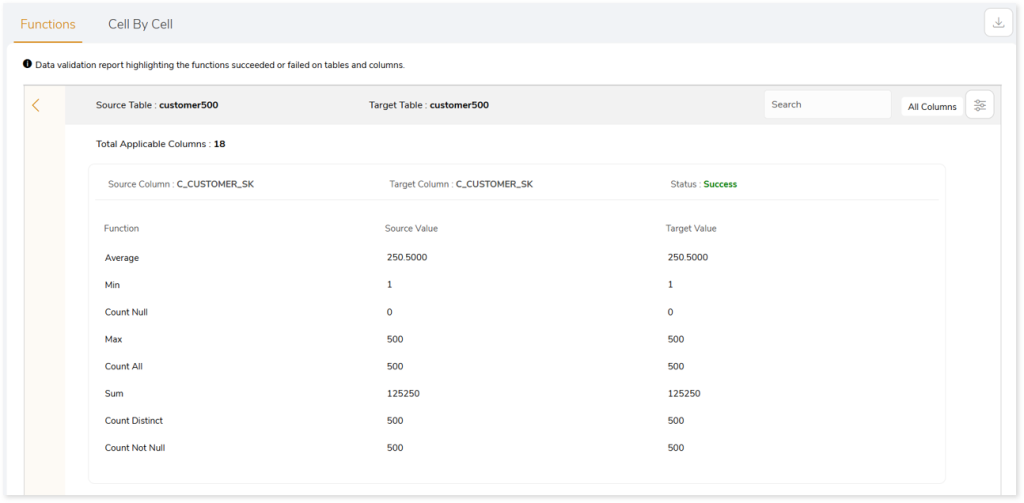
Moreover, a detailed report can be downloaded from the  . Click on the preferred table to get more information about the applied functions on the source and target.
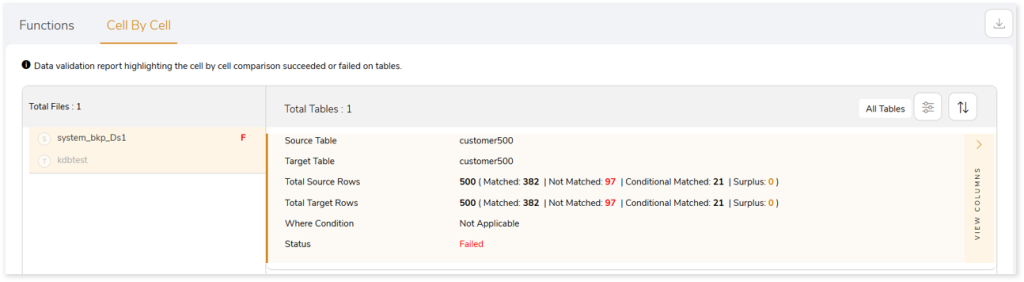
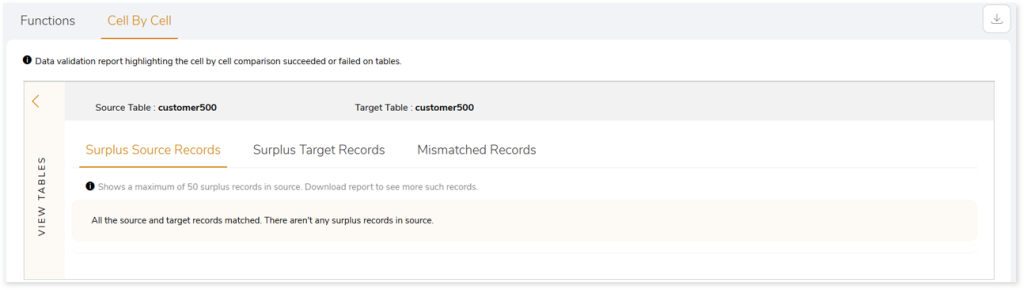
Cell by Cell
This section highlights the cell-by-cell comparison report. The left panel shows the source and target data source along with the validation status. The right panel shows information of the selected data source. It includes details of the source and target tables, total number of source and target rows, Where conditions, and the validation status of the tables.
Click to get more insights into surplus source and target records along with mismatched records.
Surplus Source Records displays the surplus records in source. It showcases a maximum of 50 surplus records.
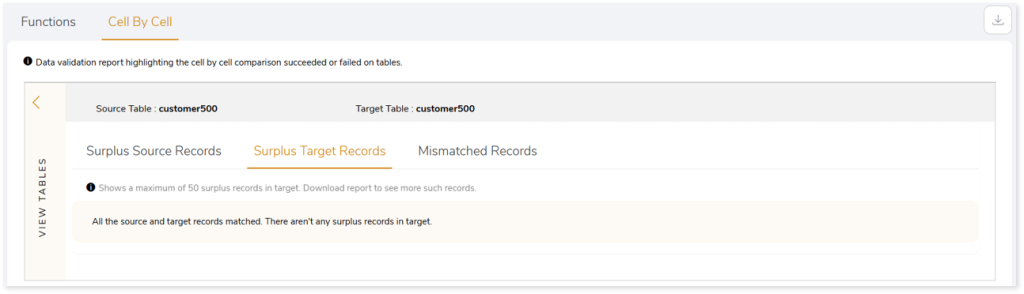
Surplus Target Records displays the surplus records in target. It showcases a maximum of 50 surplus records.
Mismatch Records displays the mismatch data between source and target. It shows a maximum of 50 mismatch records.
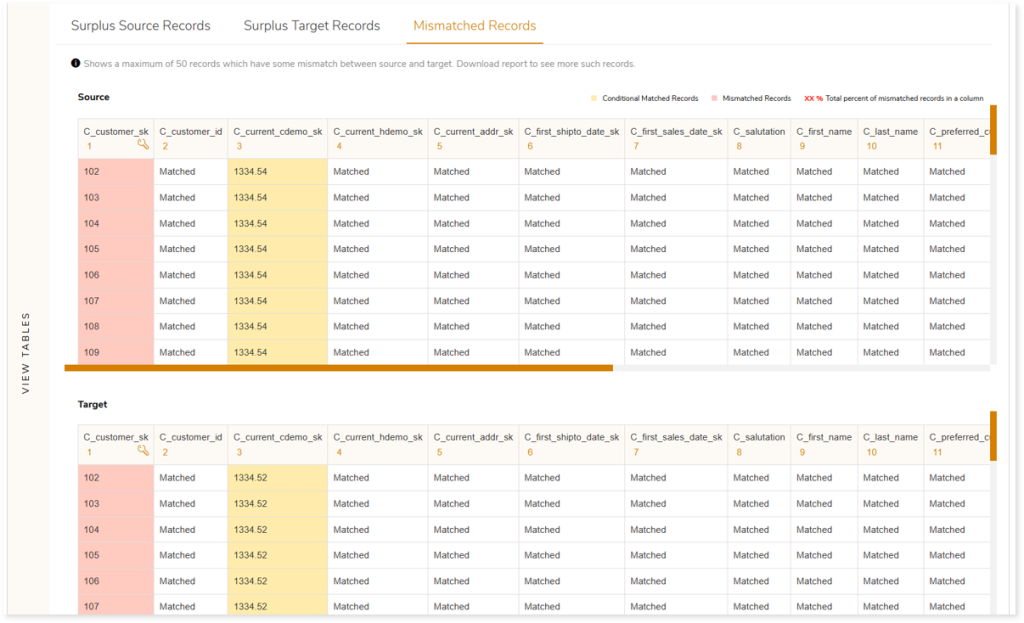
indicates the matched records based on applied conditions. In the above image, the data in the C_current_cdemo_sk column on source and target tables are highlighted based on the round(1) rule condition. Round(n) rule allows you to compare cell value after rounding off to n decimal points. For example: the value in the C_current_cdemo_sk column on source table is “1334.54” while target is “1334.52”, this cell is marked as “Conditional Matched Records” because round(1) rule is applied.
Similarly, in the below image, the email addresses are conditionally matched based on the case insensitive rule. In case insensitive rule, the system ignores case sensitivity and recognizes the same value on the source and target tables. For example: the email address present in the source column is “Army.Moses@Ovk9KjHH.com” while in target column is “AMY.MOSES@OVK9KJHH.COM”, this cell is marked as “Conditional Matched Records” because case insensitive rule is applied.
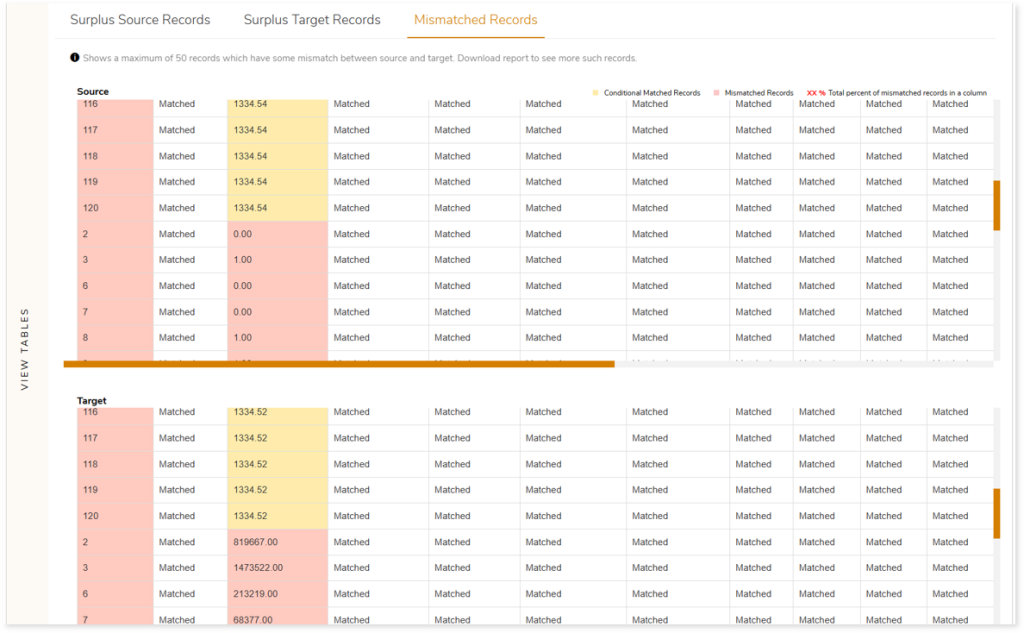
indicates the mismatched records. Here, the data in the C_current_cdemo_sk column on the source and target tables are highlighted as mismatched records because the value do not match. For example: the value in the C_current_cdemo_sk column on source is “0.00”, while it is “819667.00” on the target. As the value do not match, this cell is marked as “Mismatched Records”.
Data Validation: File and Table
Here you can see a comprehensive file-to-table/ table-to-file data validation report with mismatches highlighted at file/ table, column, and cell level. It provides a summary of:
- Total Files: Total number of files in the data validation stage.
- Matched: Displays total number of files that matched between the source and target.
- Not Matched: Displays total number of mismatched files between the source and target.
- Status: Provides status of the Data Validation stage.
- Description: Displays a brief description of the stage.
- Cell By Cell: Displays the cell-by-cell comparison details.
- Total Source Rows: Displays the total number of source rows along with success, not matched, conditional matched, and surplus data.
- Success: Displays the number of matched data between source and target.
- Mismatch: Displays the number of mismatched data between source and target.
- Conditional matched: Displays the number of matched data based on the applied conditions between source and target. While configuring data validation you can configure various rules or conditions such as trim, round (), case insensitive, regular expression, etc., for specific tables or columns. For example, in case insensitive rules, the system ignores case sensitivity and recognizes the same value in the source and target.
- Surplus: Displays the number of surplus source data.
- Total Target Rows: Displays the total number of target rows along with the success, not matched, conditional matched, and surplus data.
- Success: Displays the number of matched data between source and target.
- Mismatch: Displays the number of mismatched data between source and target.
- Conditional matched: Displays the number of matched data based on the applied conditions between source and target. While configuring data validation you can configure various rules or conditions such as trim, round (), case insensitive, regular expression, etc., for specific tables or columns. For example, in case insensitive rules, the system ignores case sensitivity and recognizes the same value in the source and target.
- Surplus: Displays the number of surplus target data.
- Row Count Difference: Displays the number of differences between source and target rows.
- Mismatched Tables: Displays the number of mismatched tables.
- Conditional Matched Tables: Displays the number of matched tables based on the applied conditions.
Functions
The Functions section shows the validation report highlighting the functions that succeeded or failed on files or tables and columns, including:
- Source File: Name of the source file.
- Target Table: Name of the target table.
- Total Functions: Displays the total number of functions used for validation.
- Applied Functions: Displays the aggregate functions used for data validation.
- Total Columns: Displays the number of columns involved in data validation.
- Status: Provides status information.
Moreover, a detailed report can be downloaded from the . Click on the preferred file or table to get more information about the applied functions on the source and target.
Cell by Cell
This section highlights the cell-by-cell comparison report. The left panel shows the total files along with the validation status. The right panel shows the respective information. It includes details of the source and target files or tables, total number of source and target rows, and the validation status of the tables.
Click to get more insights into surplus source and target records along with mismatched records.
Surplus Source Records displays the surplus records in source. It showcases a maximum of 50 surplus records.
Surplus Target Records displays the surplus records in target. It showcases a maximum of 50 surplus records.
Mismatch Records displays the mismatch data between source and target. It shows a maximum of 50 mismatch records.
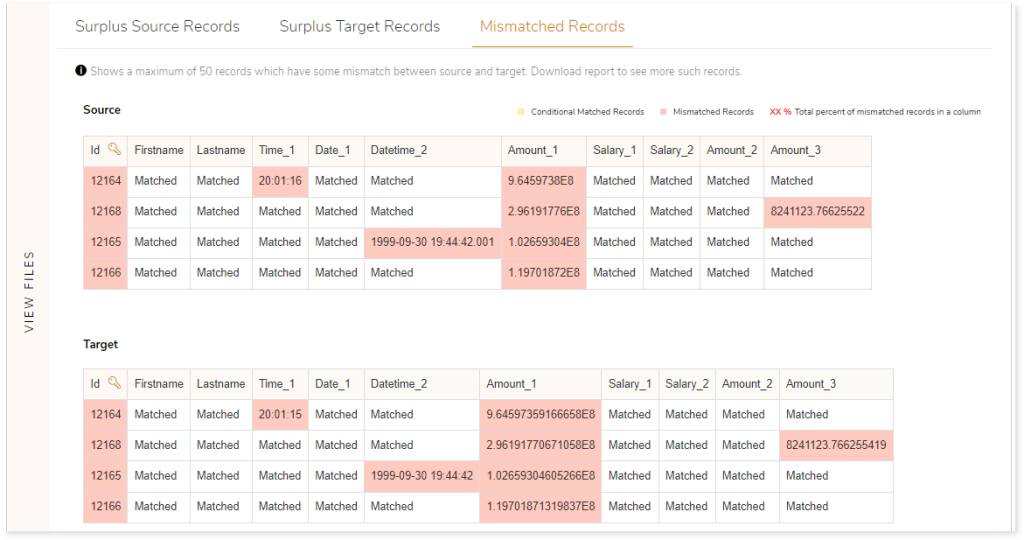
indicates the mismatched records. Here, the data in the Time_1 column on the source and target tables are highlighted as mismatched records because the value do not match. For example: the value in the Time_1 column on source is “20:01:16”, while it is “20:01:15” on the target. As the value do not match, this cell is marked as “Mismatched Records”.
indicates the matched records based on applied conditions. In the below image, the email addresses are conditionally matched based on the case insensitive rule. In case insensitive rule, the system ignores case sensitivity and recognizes the same value on the source and target tables. For example: the email address present in the source column is “Army.Moses@Ovk9KjHH.com” while in target column is “AMY.MOSES@OVK9KJHH.COM”, this cell is marked as “Conditional Matched Records” because case insensitive rule is applied.