Data and Process Lineage—Extensive Inter-Workload Dependency Analysis
The end-to-end data and process lineage identify the complete dependency chain through a variety of interactive and drill-down options till the nth level.
Typically, even within one line of business, multiple data sources, entry points, ETL tools, and orchestration mechanisms exist. Decoding this complex data web and translating it into a simple visual flow can be extremely challenging during large-scale modernization programs. The visual lineage graph adds tremendous value and helps define the roadmap to the modern data architecture. It deep dives into all the existing flows, like Autosys jobs, applications, ETL scripts, BTEQ/Shell (KSH) scripts, procedures, input and output tables, and provides integrated insights. These insights help data teams make strategic decisions with greater accuracy and completeness. Enterprises can proactively leverage integrated analysis to mitigate the risks associated with migration and avoid business disruption.
LeapLogic’s lineage helps to trace the complete data flow in steps. The visual representation helps to track how the data hopped and transformed along the way, with details of parameter changes, etc. It provides backward and forward lineage showing the hops and reference points of data lineage with a complete audit trail of the data points of interest. They also help temporarily ignore peripheral, unwanted data points like system tables, bridge tables, etc. and establish useful correlations between data points to uncover hidden patterns and results. Users can deep dive into certain flows leveraging next-gen features like contextual search, advanced filters according to workload type, an interactive visual interface, graph depth, and more.
Let’s see how you can efficiently search the required end-to-end dependency structure.
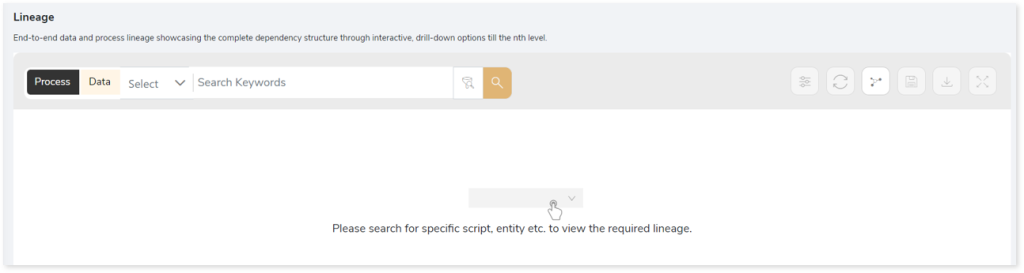
To view the required lineage:
- Select either the Process or Data tab to enable process or data lineage respectively.
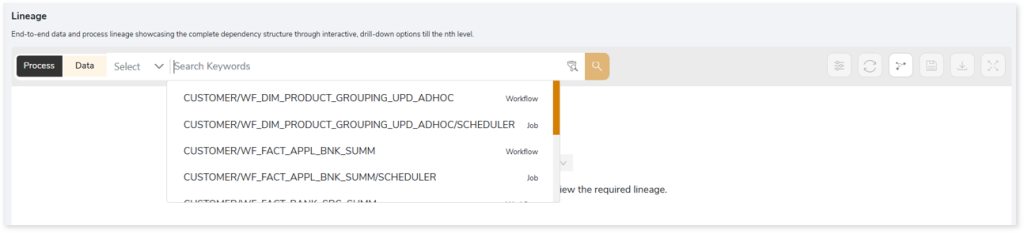
- Enter the Entity Names in the Search Keywords field you want to search. Else, simply select the entities from the Search dropdown.
- Click the Search icon to generate the lineage.

Lineage helps you understand dependencies across processes and tables:
- Process lineage illustrates the dependencies between processes or scripts such as DML files, orchestration files, procedures, Informatica workflows, DataStage jobs, etc.
- Data lineage depicts the table-level dependencies, including input tables, output tables, and reference tables.

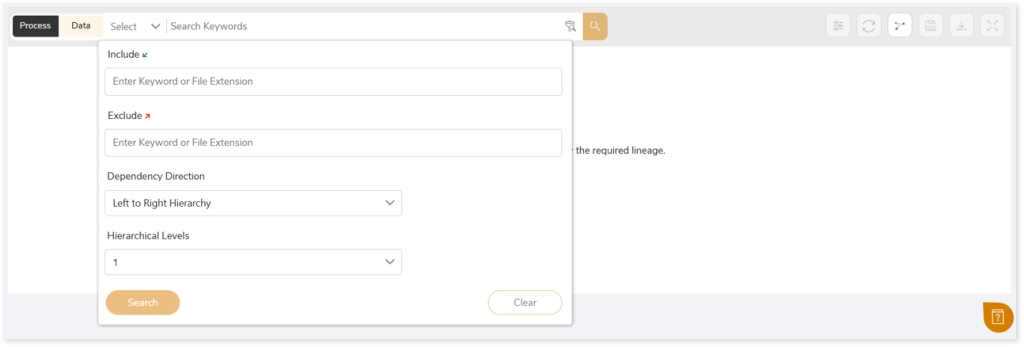
In addition, the filter search icon allows you to include or exclude particular nodes to obtain the required dependency structure. It helps you quickly narrow down complex dependency graphs to focus on the exact nodes, relationships, or data flows you want to analyze. Instead of navigating through an entire lineage network, you can apply filters based on object names, types, or relationship categories—making it easier to isolate specific tables, workflows, or transformation paths. This feature enhances traceability, reduces visual clutter, and enables you to precisely identify upstream or downstream dependencies that are most relevant to your analysis or migration scope.
You can also choose the direction of the lineage. By default, the Dependency Direction is Left to Right Hierarchy. This insight is useful to identify and analyze upstream data connections and relationships. You can also choose Right to Left Hierarchy – most useful for how data is getting consumed through the downstream route and which are the participating tables and columns, or Bidirectional dependency direction to visualize both kinds in a single view.
Moreover, you can also increase the Hierarchy Levels to nth level. This again allows great freedom to visualize the end-to-end hierarchy in one go.
Lineage facilitates you visualize how your selected nodes are connected and depend on each other. The nodes and their connecting edges (relationships) help you to understand the overall structure and dependencies.
|
Nodes |
Edges |
 Tables Tables |
 Call Call |
 File File |
 Read Read |
 Job Job |
 Execute Execute |
 Autosys Box Autosys Box |
 Write Write |
 Workflows Workflows |
 Others Others |
 Flat File Flat File |
|
 DB Type DB Type |
|
To enhance your interaction with the lineage graph, you can apply the following features.
| Feature | Icon | Use |
| Filter |  | Used to filter the lineage. |
| Reload Graph |  | Assists in reloading graphs. |
| Manage Graph |  | To view and manage lineage by adding, modifying, or deleting nodes and their relationships to accurately reflect dependency structures. |
| Save |  | Used to save the lineage. |
| Download |  | Used to download the file. |
| Expand |  | Used to enlarge the screen. |
To learn more about managing lineage, including how to add, modify, or delete nodes and their relationships, click here.
Downloadable Reports
Downloadable lineage reports provide a consolidated view of dependencies, enabling you to review and analyze lineage information effectively. These reports are categorized as Integrated Lineage or Standalone Lineage, depending on the type of assessment performed.
Integrated Lineage
Integrated lineage report is generated when an integrated assessment is performed—such as ETL, DML, orchestration, etc. These reports provide a unified view of data flow across interconnected systems and processes.
Lineage Dependency.csv: This report provides detailed lineage information for various scripts, including script type, direct dependencies, used, indirectly used, and impacted tables, jobs, files, and other components.
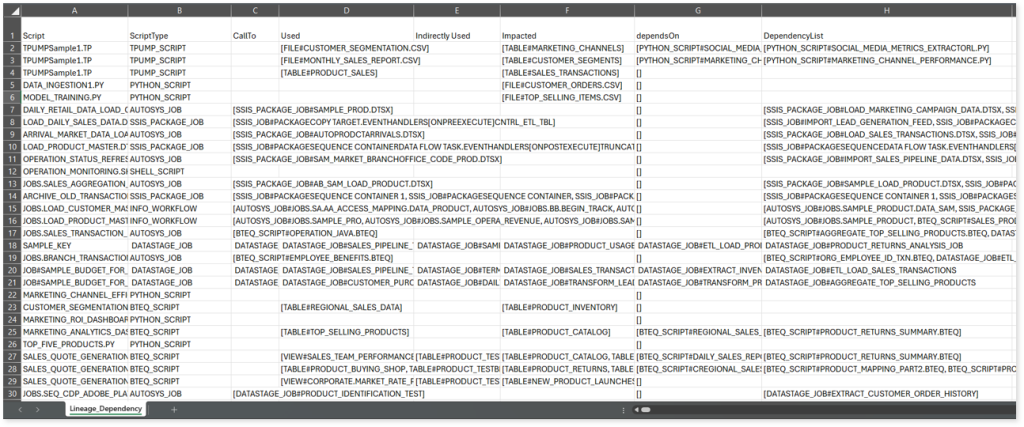
This report contains the following information:
- Script: Displays the name of the process such as job, script, etc.
- ScriptType: Displays the type of the process, such as TPUMP script, Python script, Autosys job, DataStage job, etc.
- CallTo: Provides details of processes invoked by the current process.
- Used: Provides details of entities (files, tables) used or read by the current process.
- Indirectly Used: Provides details of entities (files, tables) utilized or read indirectly by the current process.
- Impacted: Provides details of entities (files, tables) that are impacted or written by the current process.
- dependsOn: Provides details of processes that the current process directly depends on.
- DependencyList: Provides details of all the processes that the current process depends on (both direct and indirect dependencies).
Standalone Lineage
Standalone lineage reports are generated when a standalone assessment is performed. Here, taking Informatica as an example, the downloaded report includes the following lineage reports:
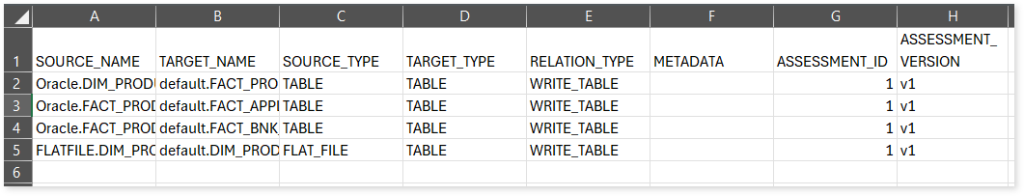
- informatica_dataLineage.csv: This report provides information about entity or file level lineage based on write operation.
- Lineage Report: This report provides complete dependency details for all nodes. It provides an end-to-end data and process lineage that helps to identify the complete dependency structure and the data flow.
This report contains the following information:
- Volumetric Info: Provides volumetric information about the artifact types including tables, database types, workflows, flat files, and scheduler jobs.
- Nodes: Lists all the source and target nodes along with their type. Each node represents a data object in the lineage—such as a table, file, job, etc.—making it easier to trace how data is consumed, transformed, and processed across the workflow.
- Dependency (Process): Provides information about the process lineage. It offers detailed visibility into interdependencies between processes—such as files, workflows, and orchestration steps—helping you understand how they are connected within the workflow.
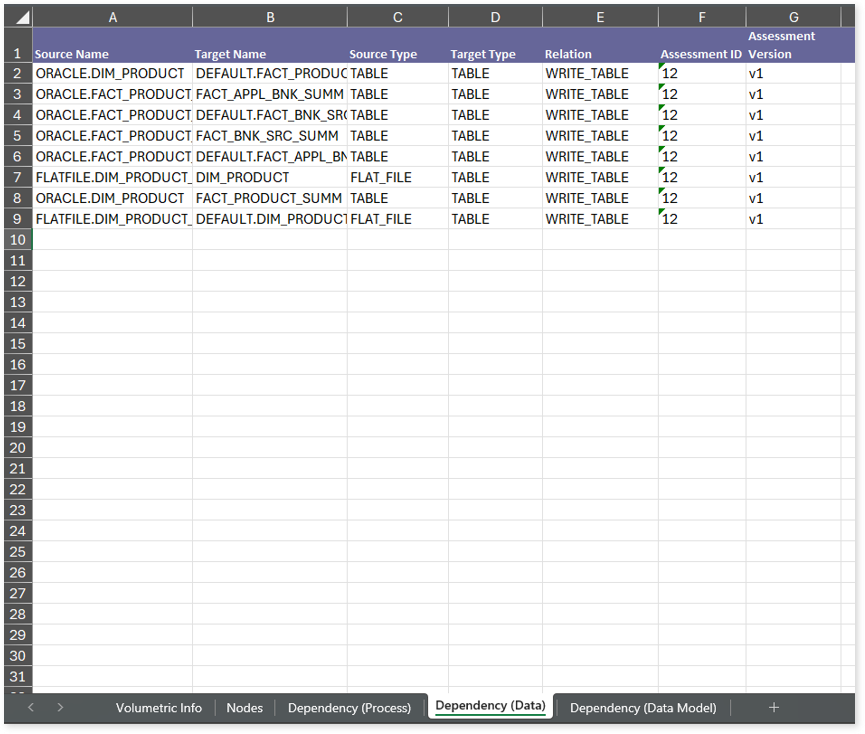
- Dependency (Data): Provides information about the data lineage. It captures detailed table-level—including input tables, output tables, and reference tables—offering end-to-end visibility into how data flows and transforms across the workflow.
- Dependency (Data Model): Provides information about the data model lineage. It highlights the end-to-end relationships and dependencies between model elements, helping users understand structure and trace linkages.
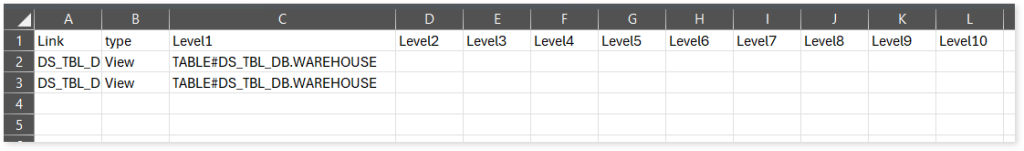
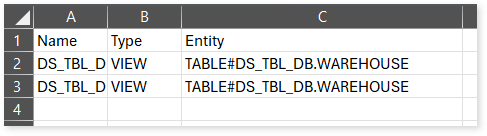
entity_links.csv: This report provides information about how views are connected to entities or tables and how these links extend across multiple levels. Level 1 shows the immediate table to which a view is linked. If that table is further connected to another entity, the next connection appears in Level 2, and so on.
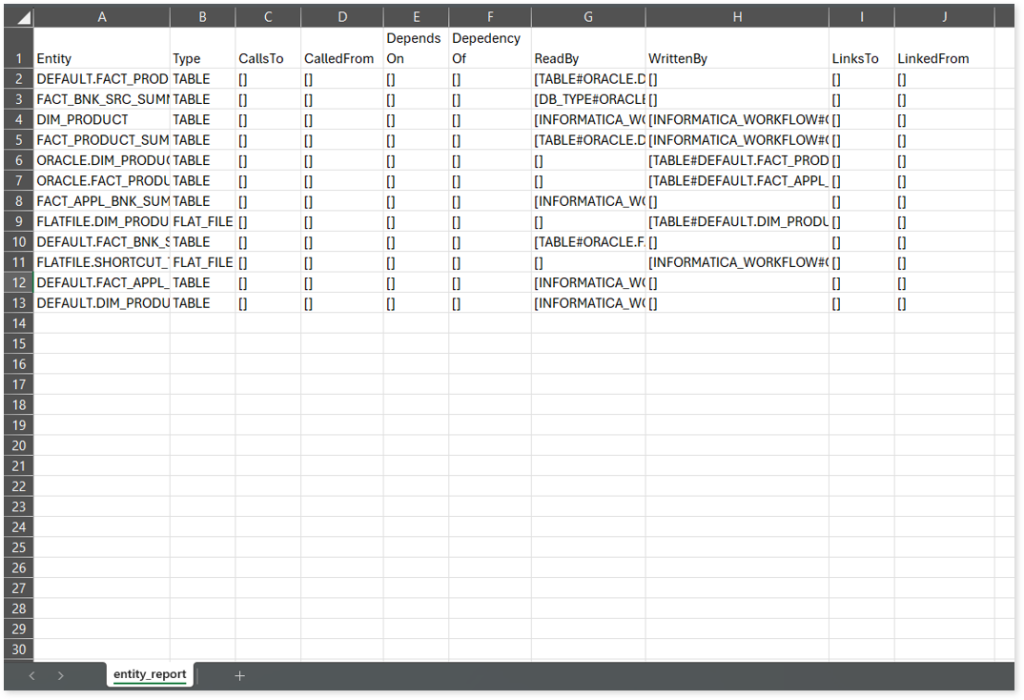
entity_report.csv: This report provides detailed lineage information for each entity within the uploaded source files. It provides a comprehensive list of all entities along with their respective types, identifies the processes or scripts that read from or write to each entity, and includes other dependency details.
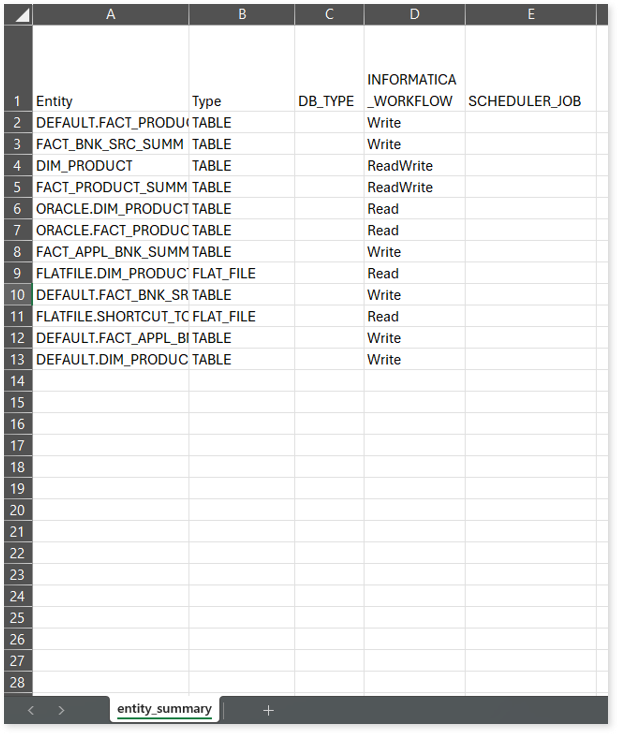
entity_summary.csv: This report provides a list of entities from uploaded source files, indicating where they appear (e.g., workflow, scheduler job, or database type) and the operations performed on them—Read, Write, or ReadWrite.
link.csv: This report provides information about entities linked to each view.
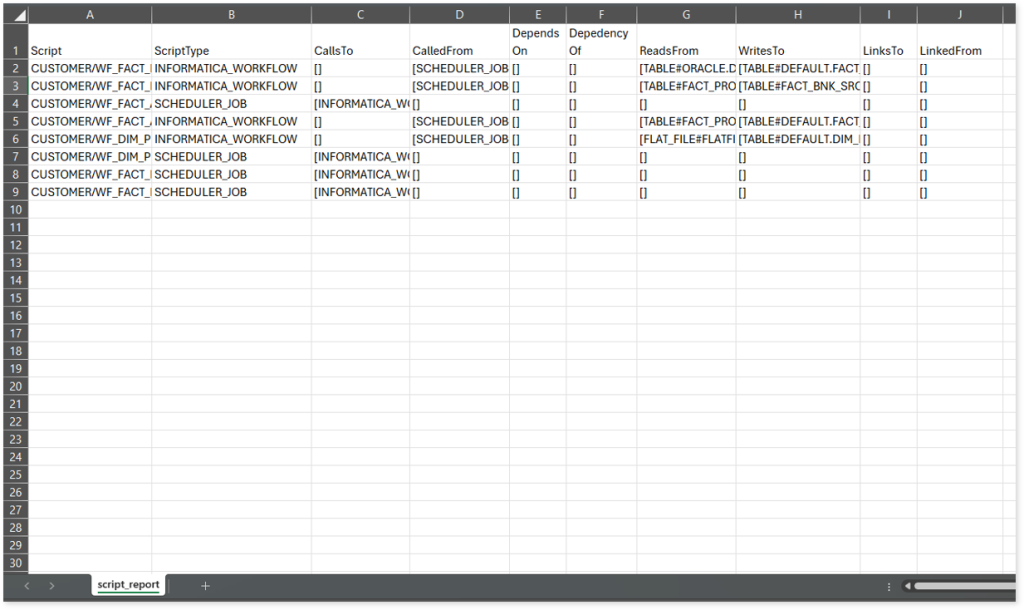
script_report.csv: This report provides detailed lineage information for each script. It lists all scripts along with their type, specifies the processes, entities, or scripts from which each script reads data and those to which it writes, as well as other dependency details.
In summary, lineage is more than a technical capability—it’s a foundational element for intelligent modernization. By offering comprehensive visibility into data flows and process dependencies, LeapLogic empowers enterprises to plan, validate, and execute migrations with precision. This holistic insight not only protects business-critical systems but also accelerates modernization by enhancing trust, ensuring compliance, and improving operational agility. With robust lineage capabilities, organizations can navigate their cloud transformation journey with clarity, confidence, and control.
To explore the column-level lineage, click here.