Home »
License » BI Conversion – License Deduction Criteria
BI Conversion – License Deduction Criteria
This topic provides information about the license deduction criteria used in LeapLogic to transform legacy BI workloads to a modern BI platform equivalent.
In This Topic:
License Deduction Criteria
When you transform legacy BI workloads in LeapLogic, the script license quota is deducted for each script upon successful conversion to its target equivalent. Scripts that fail to convert do not consume the license quota.
Taking Tableau as an example, the script license quota is deducted for each .twb file that is successfully converted to the target platform such as Power BI, Amazon QuickSight, etc.
The overall license deduction logic is determined by the following criteria:
- File Similarity
- Automation Level Indicator
- Number Successfully Converted Scripts
The following sections provide a detailed explanation of each criterion.
File Similarity
The platform employs a similarity evaluation framework that determines the relative correspondence of an incoming file against a corpus of previously processed artifacts. This evaluation yields a similarity index which, in turn, is reconciled with internally governed threshold parameters. The interaction between these values serves as the basis for deciding whether an adjustment to the license quota becomes applicable. In certain conditions—when the index exhibits sufficient divergence or proximity to the threshold—quota units may be appropriated, while under alternative conditions, no adjustment is applied.
Accordingly, files demonstrating pronounced affinity to earlier executions may, under some circumstances, bypass incremental quota attribution, whereas those exhibiting less congruence may result in measurable deductions. The precise determination is mediated by proprietary system logic, operating on layered interpretations of similarity scores.
Automation Level Indicator
Automation Level Indicator refers to the extent to which scripts are automatically converted from source to the target equivalent. Higher automation level indicator value indicates that most of the script is automatically converted and requires less manual intervention. The script quota deduction depends on whether the automation level indicator meets or exceeds the predefined threshold value.
Number of Successfully Transformed Scripts
This is one of the criteria used for license quota deduction, where the deduction depends on the number of successfully transformed scripts or .twb files.
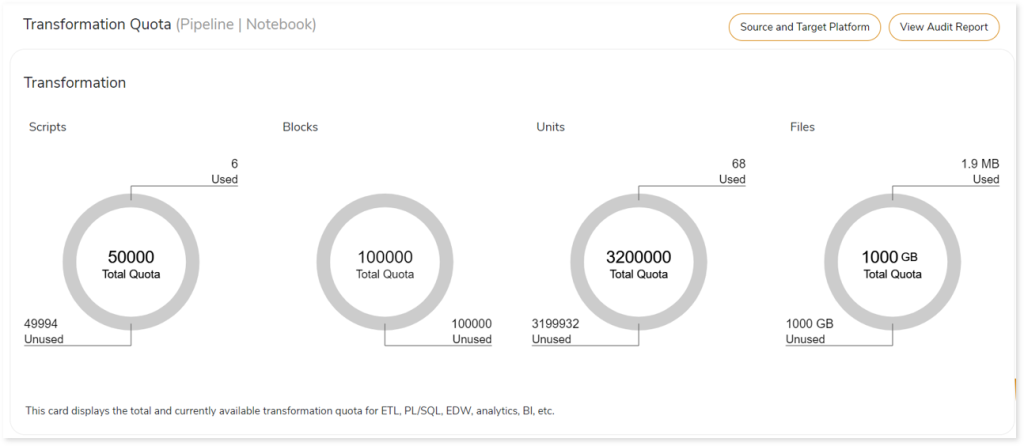
View Transformation Quota Details
Follow these steps to see detailed license information:
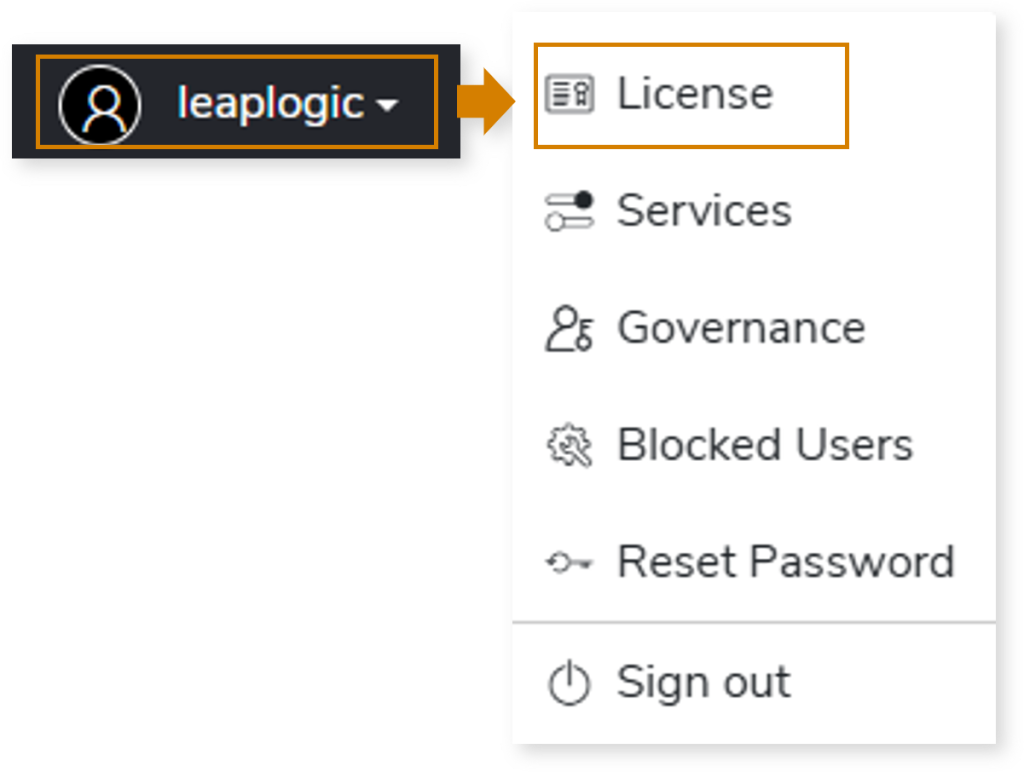
- Click your username at the top right corner of the screen.
- Click License from the menu.
- The Manage Licenses window opens. Click View Details to see detailed license information.
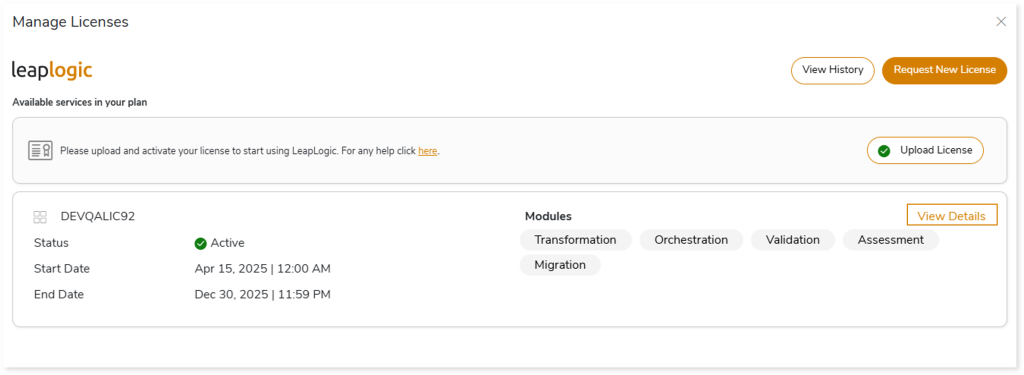
- The License Details page opens. This page provides comprehensive information about your licensing status, quota consumption, activated licenses, upcoming licenses, and a history of expired licenses. You can also monitor the granted licenses and LeapLogic service usages from this page.
For more information about your license, click here.
BI Transformation Report
The Transformation Report provides a comprehensive summary of the transformation along with the associated deductible license quota. You can view the Tableau transformation report below.
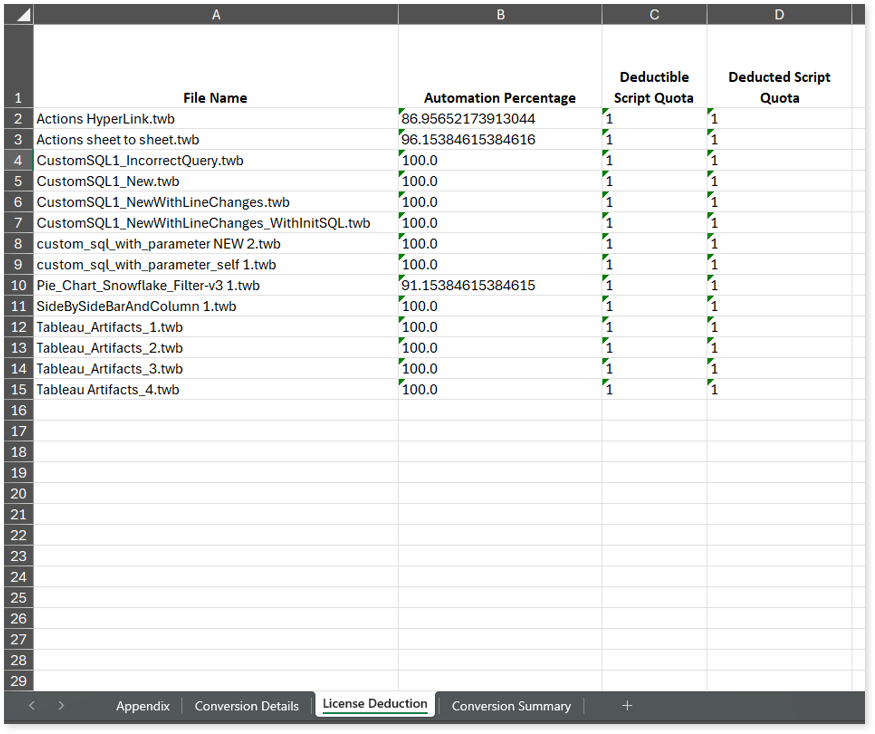
The License Deduction sheet (refer to the image above) in the Tableau_Conversion_Report.xlsx file displays detailed information about the license quota deducted for the conversion.
- File Name: Displays the name of the file.
- Automation Percentage: Displays the auto-conversion percentage of each file.
- Deductible Script Quota: Displays the script quota that needs to be deducted based on various criteria.
- Deducted Script Quota: Displays the actual script quota deducted.
The Appendix sheet in the Tableau_Conversion_Report.xlsx file provides the weightage of each component used to calculate the automation level indicator.
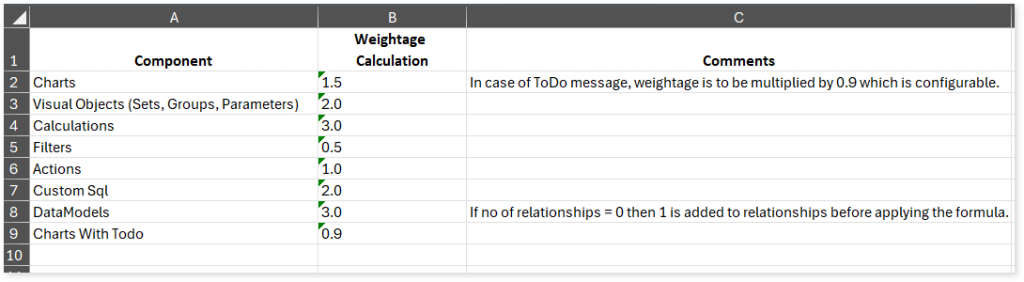
- Component: Displays the name of each component.
- Weightage Calculation: Displays the default weightage assigned to each component.
- Comments: Displays the comment or any additional messages.
The Conversion Details Summary sheet in the Tableau_Conversion_Report.xlsx file provides information about various components such as chats, visuals, calculations, tables, filters, and more, along with the number of successful, partially successful, and failed components.
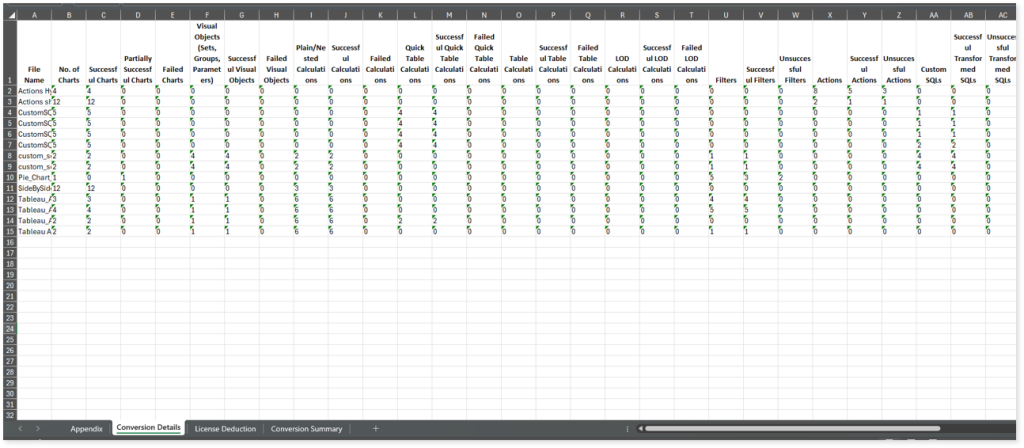
- File Name: Displays the name of the file.
- No. of Charts: Displays the total number of charts in each file.
- Successful Charts: Displays the number of charts successfully converted.
- Partially Successful Charts: Displays the number of converted charts with a ToDo message.
- Failed Charts: Displays the number of chats that failed to convert.
- Visual Objects (Sets, Groups, Parameters): Displays the total number of visual objects in each file.
- Successful Visual Objects: Displays the number of successfully converted visual objects.
- Failed Visual Objects: Displays the number of visual objects that failed to convert.
- Plain/Nested Calculations: Displays the total number of plain or nested calculations in each file.
- Successful Calculations: Displays the number of successfully converted calculations.
- Failed Calculations: Displays the number of calculations that failed to convert.
- Quick Table Calculations: Displays the total number of quick table calculations in each file.
- Successful Quick Table Calculations: Displays the number of successfully converted quick table calculations.
- Failed Quick Table Calculations: Displays the number of quick table calculations that failed to convert.
- Table Calculations: Displays the total number of table calculations in each file.
- Successful Table Calculations: Displays the number of successfully converted table calculations.
- Failed Table Calculations: Displays the number of table calculations that failed to convert.
- LOD Calculations: Displays the total number of LOD calculations in each file.
- Successful LOD Calculations: Displays the number of successfully converted LOD calculations.
- Failed LOD Calculations: Displays the number of LOD calculations that failed to convert.
- Filters: Displays the total number of filters in each file.
- Successful Filters: Displays the number of successfully converted filters.
- Unsuccessful Filters: Displays the number of filters that failed to convert.
- Actions: Displays the total number of actions in each file.
- Successful Actions: Displays the number of successfully converted actions.
- Unsuccessful Actions: Displays the number of actions that failed to convert.
- Custom SQLs: Displays the total number of custom SQLs in each file.
- Successful Transformed SQLs: Displays the number of successfully converted custom SQLs.
- Unsuccessful Transformed SQLs: Displays the number of SQLs that failed to convert.
- DataModels: Displays the total number of data models in each file.
- Successful DataModels: Displays the number of successfully converted data models.
- Unsuccessful DataModels: Displays the number of data models that failed to convert.
- Relationships: Displays the total number of relationships in each file.
- Successful Relationships: Displays the number of successfully converted relationships.
- Unsuccessful Relationships: Displays the number of relationships that failed to convert.
- Automation Percentage: Displays the automation level indicator of each file.
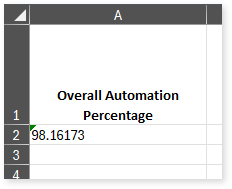
The Conversion Summary sheet in the Tableau_Conversion_Report.xlsx file displays the overall automation level indicator, calculated across all the input files.