Shell Assessment Report
This topic provides information about the Shell script assessment report. The assessment report offers a comprehensive analysis of shell scripts to support strategic migration planning. It assesses the script inventory and provides in-depth insights into SQL commands, operations, functions and end-to-end data and process lineage. These insights help estimate effort, streamline migration, and reduce associated migration risks. The supported input formats include SH, KSH, BASH, CSH, and ZSH.
In This Topic:
Highlights
The Highlights section provides a high-level overview of the analytics performed on the selected workloads. It includes information about the script inventory, complexity across scripts, queries, statement types, and blocks.
Summary
This section provides an overview of input shell scripts along with their details such as files, operations, SQL commands, functions, and more.
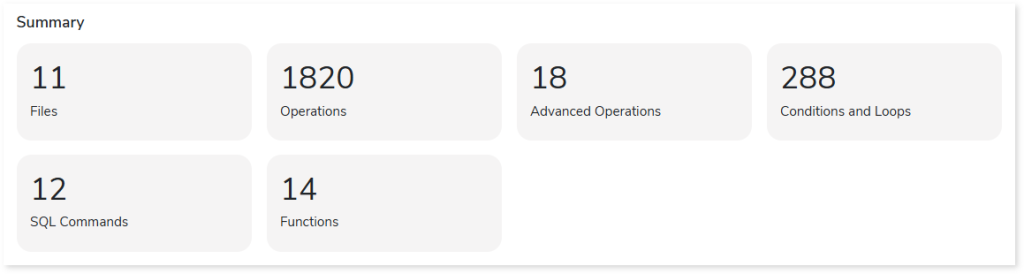
- Files: Displays the total number of input files.
- Operations: Displays the total number of operations (including single-line and multi-line commands) present in the input files.
- Advanced Operations: Displays the total number of advanced operations (such as awk commands, sed commands, etc.) present in the input files.
- Conditions and Loops: Displays the total number of conditions (expressions that control the flow of execution) and loops present in the input files.
- SQL Commands: Displays the total number of SQL commands present in the input files.
- Functions Count: Displays the total number of functions present in the input files.
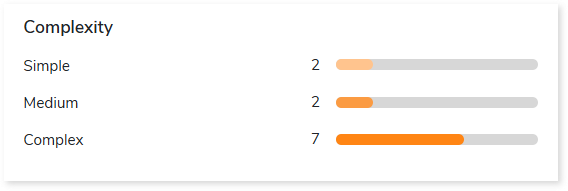
Complexity
This section provides a summarized graphical representation of the classification of Shell scripts based on a detailed complexity assessment. This information helps support various decisions, including migration planning and budget estimation.
Queries
This section provides a detailed breakdown of total, analyzed, and unanalyzed queries along with the complexity of analyzed queries.
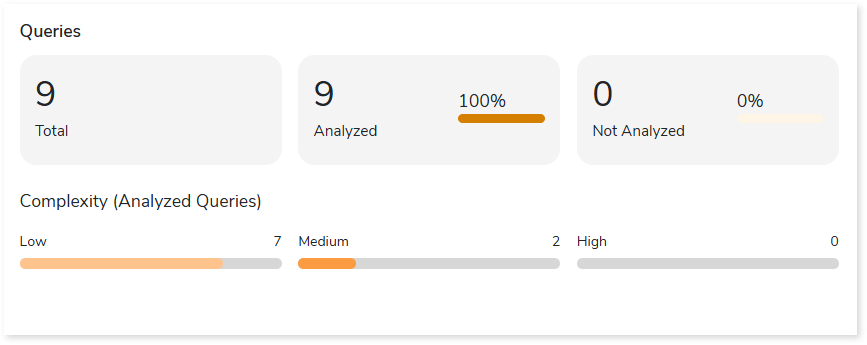
- Total: Displays the total number of queries.
- Analyzed: Displays the total number of analyzed queries.
- Not Analyzed: Displays the total number of unanalyzed queries.
- Complexity (Analyzed Queries): Displays the complexity of analyzed queries.
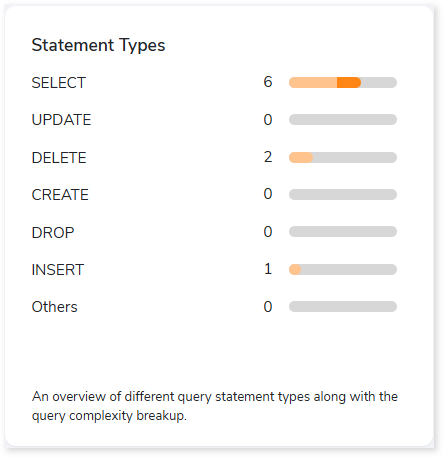
Statement Types
This section displays a summary of analyzed queries based on the query distribution sorted by the different query statement types in the input source file. Moreover, it displays a visual representation of the complexity breakdown across various statement types.
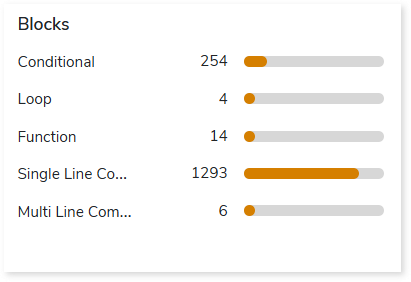
Blocks
This section provides a summary of various block types such as conditions, loops, functions, etc., along with their respective counts.
Analysis
This topic provides a detailed examination of source files, external scripts, data categorized by commands, and queries.
Source Information
This section provides information about command lines, commented lines, inline queries, variables, complexity, and more present in each script.
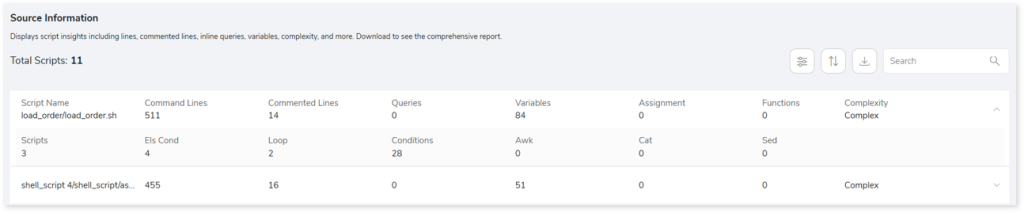
- Script Name: Displays the name of the script.
- Command Lines: Displays the number of command lines present in each script.
- Commented lines: Displays the number of commented lines present in each script.
- Queries: Displays the number of queries present in each script.
- Variables: Displays the number of variables present in each script.
- Assignment: Displays the number of assignments present in each script.
- Functions: Displays the number of functions present in each script.
- Complexity: Displays the complexity of each script.
- Scripts: Displays the number of external scripts called in each source Shell script.
- Els Cond: Displays the number of else conditions present in each script.
- Loop: Displays the number of loops (such as for, while, etc.) present in each script.
- Conditions: Displays the number of conditions (expressions that control the flow of execution) present in each script.
- Awk: Displays the number of Awk commands present in each script.
- Cat: Displays the number of Cat commands present in each script.
- Sed: Displays the number of Sed commands present in each script.
External Scripts
This section provides information about external scripts including type, source file, and argument count.
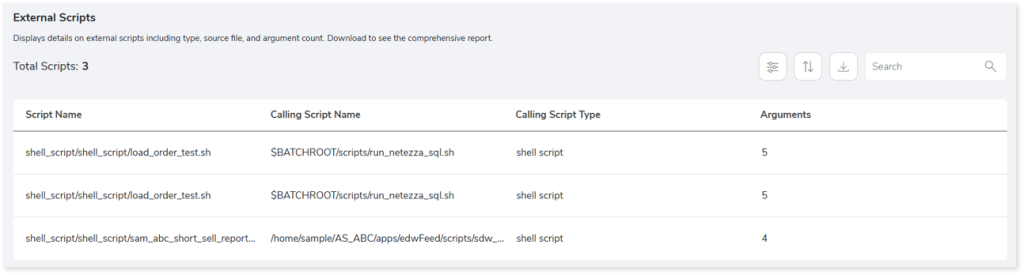
- Script Name: Displays the name of the input file.
- Calling script Name: Displays the name of the calling script or external script in each input script.
- Calling Script Type: Displays the type of each calling script or external script.
- Arguments: Displays the arguments used in each calling script or external script.
Data
This section provides information about data categorized by commands (e.g., sed, cat, mkdir, etc.) along with the source and associated files.
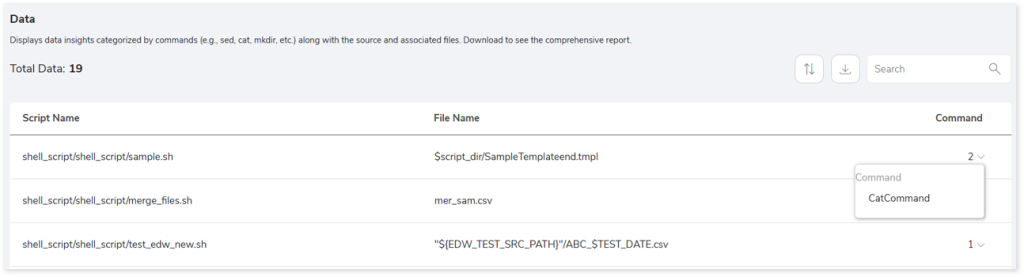
- Script Name: Displays the name of the input file.
- File Name: Displays the name of the calling scripts or external files in each input script.
- Command: Displays the number of commands used to categorize the data in each calling scripts or external files. Click the down arrow to view the command type.
Queries
This section provides information about query including database type, statement type, used and impacted tables, complexity, and more.
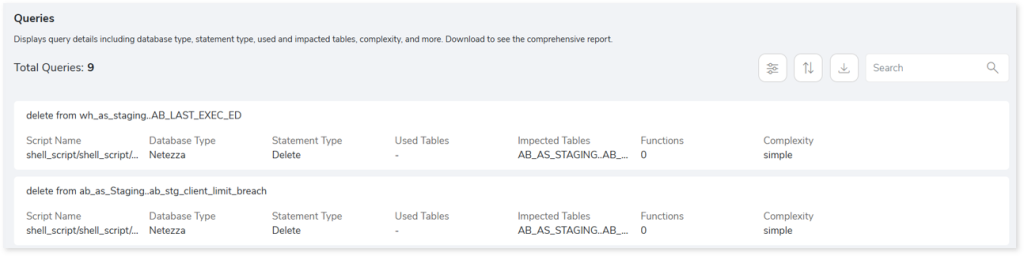
- Script Name: Displays the name of the input file.
- Database type: Displays the database type.
- Statement type: Displays the statement type of each query.
- Used Tables: Displays the name of the table used in each query.
- Impacted tables: Displays the name of the impacted table in each query.
- Functions: Displays the number of functions in each query.
- Complexity: Displays the complexity of each query.
Lineage
End-to-end data and process lineage identify the complete dependency structure through interactive and drill-down options to the last level.
Typically, even within one line of business, multiple data sources and entry points exist. Decoding this complex data web and translating it into a simple visual flow can be extremely challenging during large-scale modernization programs. The visual lineage graph adds tremendous value and helps define the roadmap to the modern data architecture. It deep dives into all the existing flows, like Shell scripts, Autosys jobs, applications, ETL scripts, BTEQ/Shell (KSH) scripts, procedures, input and output tables, and provides integrated insights. These insights help data teams make strategic decisions with greater accuracy and completeness. Enterprises can proactively leverage integrated analysis to mitigate the risks associated with migration and avoid business disruption.
Now, let’s see how you can efficiently manage lineage.
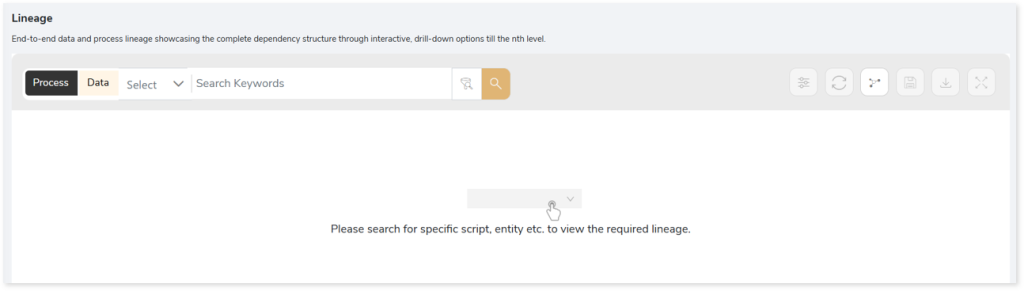
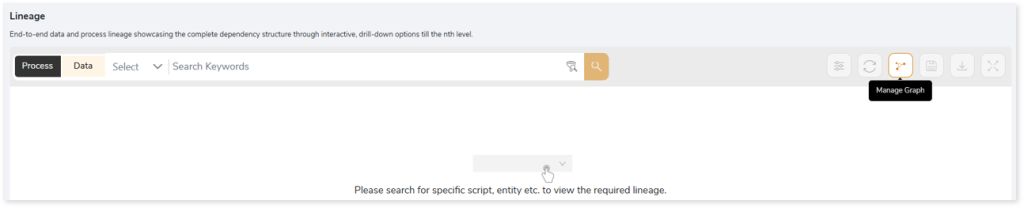
To view the required lineage:
- Select either the Process or Data tab.
- Enter the keywords in the Search Keywords field.
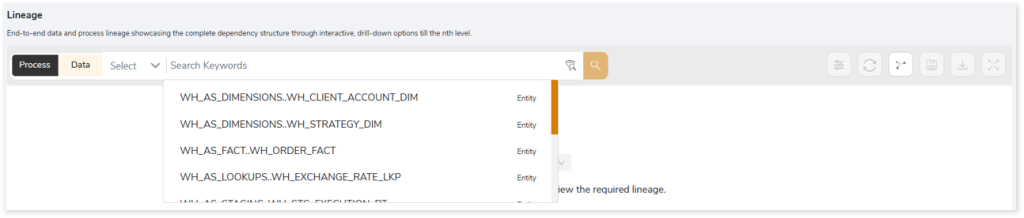
- Click the Search icon to generate the lineage.
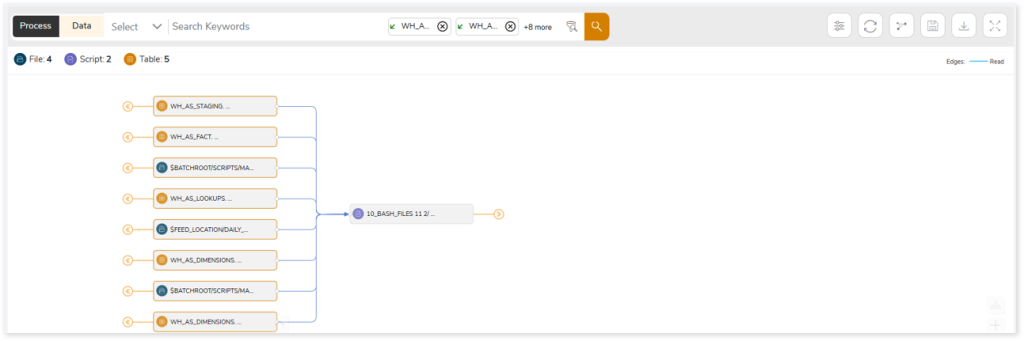
Lineage helps you understand dependencies across processes and tables:
- Process lineage illustrates the dependencies between two or more processes such as shell script file-to-entity and shell script file-to-data files interdependencies and vice versa.
- Data lineage depicts data flow between two or more data-holding components such as entity-to-entity and data file-to-data file interdependencies and vice versa.
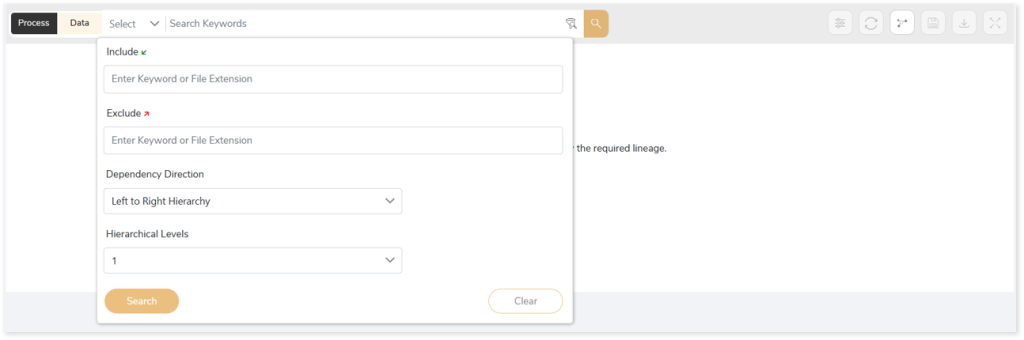
In addition, the filter search icon allows you to include or exclude particular nodes to obtain the required dependency structure. You can also choose the direction of the lineage. By default, the Dependency Direction is Left to Right Hierarchy. You can also choose Right to Left Hierarchy or Bidirectional dependency directions as required. Moreover, you can also increase the Hierarchy Levels to nth level.
Lineage facilitates you visualize how your selected nodes are connected and depend on each other. The nodes and their connecting edges (relationships) help you to understand the overall structure and dependencies.
|
Nodes |
Edges |
 Tables Tables |
 Read Read |
 File File |
 Write Write |
 Script Script |
 Execute Execute |
Manage Lineage
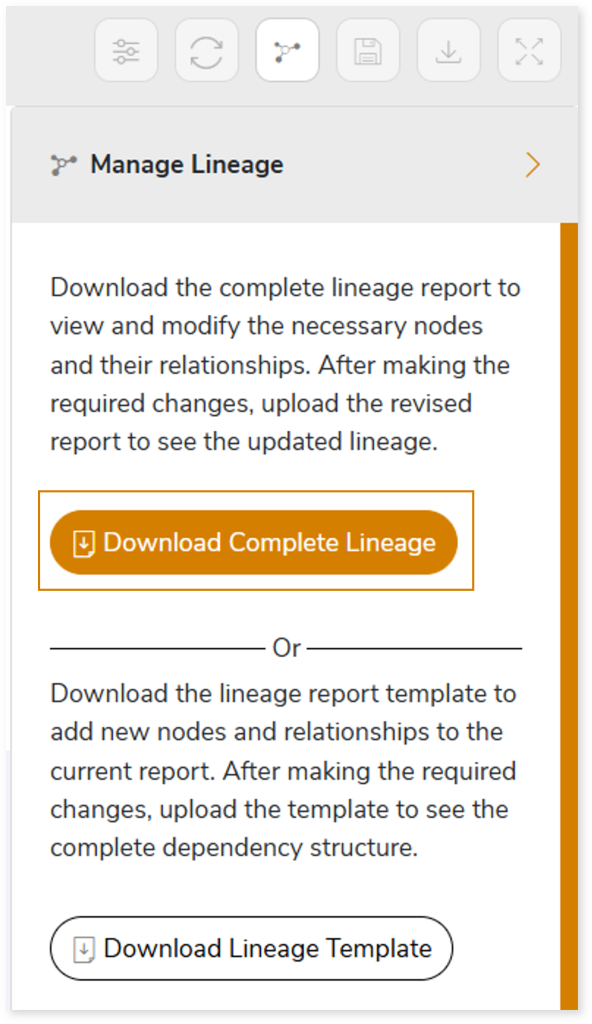
This feature enables you to view and manage your lineage. You can add, modify, or delete nodes and their relationships to generate an accurate representation of the required dependency structure. There are two ways to update the lineage: either using Complete Lineage report or Lineage Template.
Using Complete Lineage report
Follow the below steps to modify the lineage:
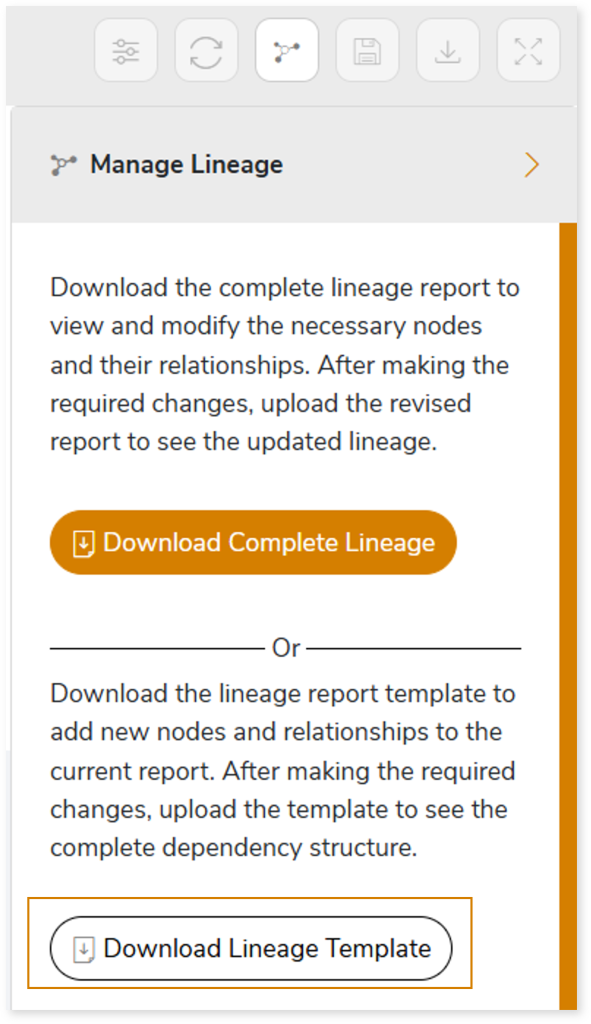
- Click the Manage Graph icon.
- Click Download Complete Lineage to update, add, or delete the nodes and their relationships in the current lineage.
- Once the complete lineage report is downloaded, you can make necessary updates such as updating, deleting or adding the nodes and its relationships.
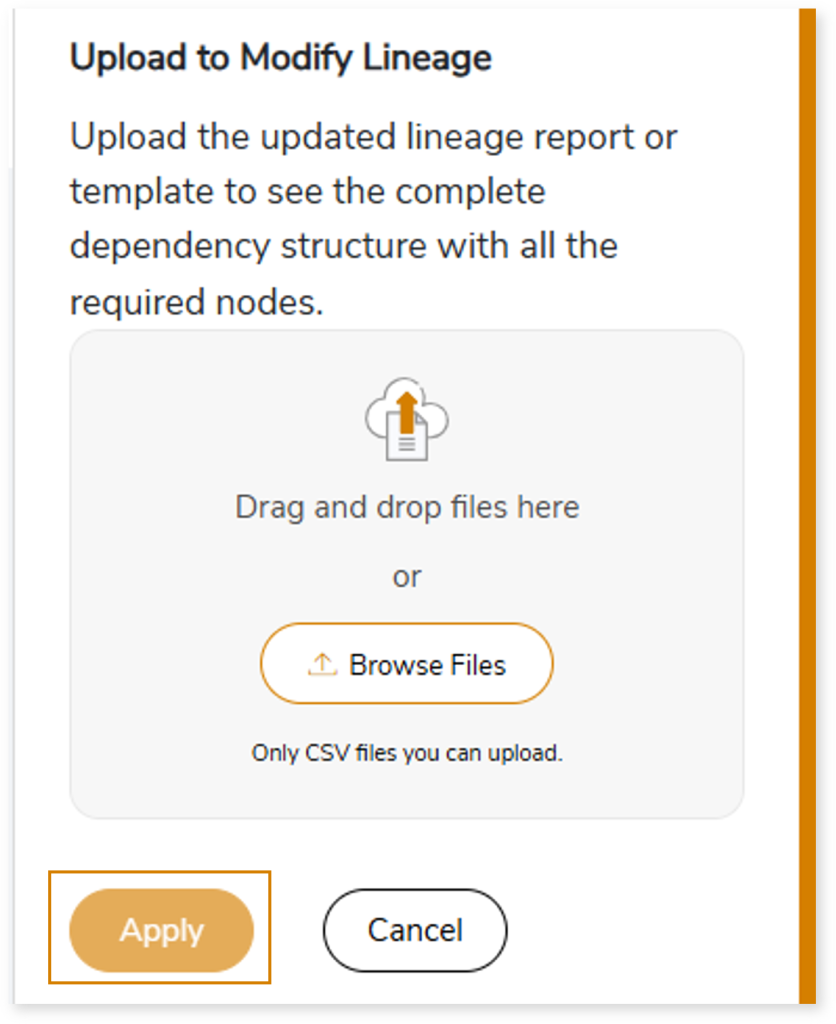
- After making the required changes, upload the updated lineage report in Upload to Modify Lineage.
- Click Apply to incorporate the updates into the dependency structure.
- Generate the required process or data lineage.
Using Lineage Template
Follow the below steps to add new nodes and their relationships to the current lineage report:
- Click the Manage Graph icon.

- Click Download Lineage Template.
- Once the lineage template is downloaded, you can add new nodes and relationships in the template.
- After making the required changes, upload the template in Upload to Modify Lineage.
- Click Apply to incorporate the updates into the complete dependency structure.
- Generate the required process or data lineage.

Downloadable Reports
Downloadable reports allow you to export detailed assessment reports of your source data which enables you to gain in-depth insights with ease. To access these assessment reports, click Reports.

Types of Reports
In the Reports section, you can see various types of reports such as Insights and Recommendations, Source Inventory Analysis, and Lineage Analysis. Each report type offers detailed information allowing you to explore your assessment results.

Insights and Recommendations
This report provides an in-depth insight into the source input files.
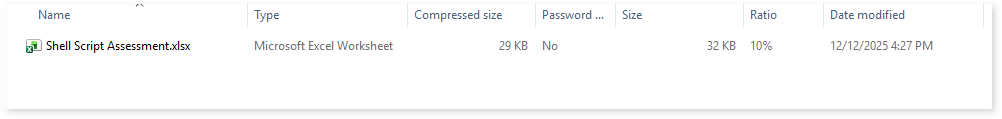
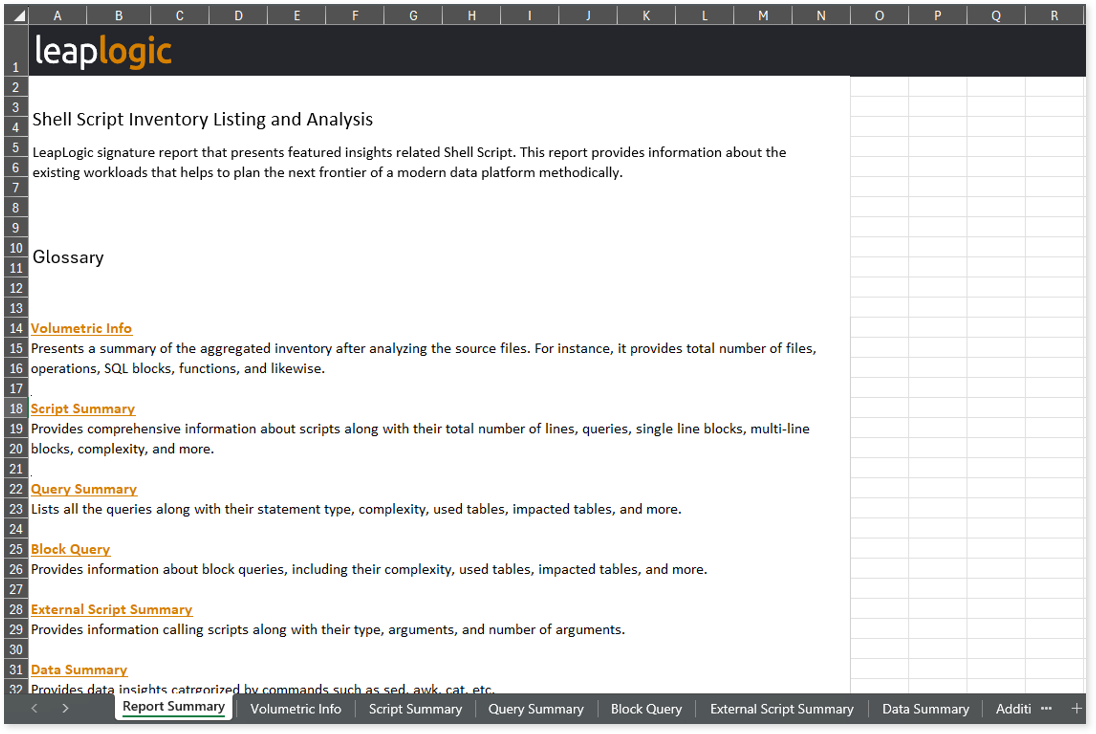
Shell Script Assessment.xlsx: This report provides insights about the source inventory. It helps you plan the next frontier of a modern data platform methodically. It includes a report summary, aggregated inventory, scripts, queries, blocks, and more.
This report contains the following information:
- Volumetric Info: Presents a summary of the aggregated inventory after analyzing the source files. For instance, it provides total number of files, operations, SQL blocks, functions, and likewise.
- Script Summary: Provides comprehensive information about scripts along with their total number of lines, queries, single line blocks, multi-line blocks, complexity, and more.
- Query Summary: Lists all the queries along with their statement type, complexity, used tables, impacted tables, and more.
- Block Query: Provides information about block queries, including their complexity, used tables, impacted tables, and more.
- External Script Summary: Provides information calling scripts along with their type, arguments, and number of arguments.
- Data Summary: Provides data insights categorized by commands such as sed, awk, cat, etc.
- Additional Commands: Lists all the additional commands present in the source shell script along with their count and input statements.
- File Similarity: Provides the resemblance index by comparing one file with another. Each comparison generates a File Resemblance Index that reflects the extent of similarity. Files that are successfully compared are marked as Success in the Status, while those that fail display an appropriate error message.
Source Inventory Analysis
It is an intermediate report which helps to debug failures or calculate the final report.
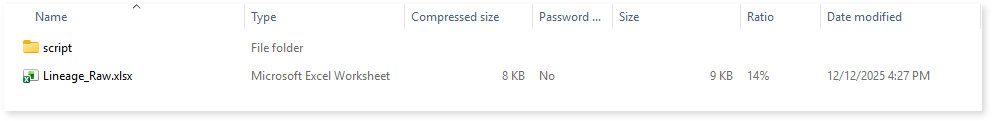
Lineage_Raw.xlsx: This report provides complete dependency details for all nodes. It provides an end-to-end data and process lineage that helps to identify the complete dependency structure and the data flow.
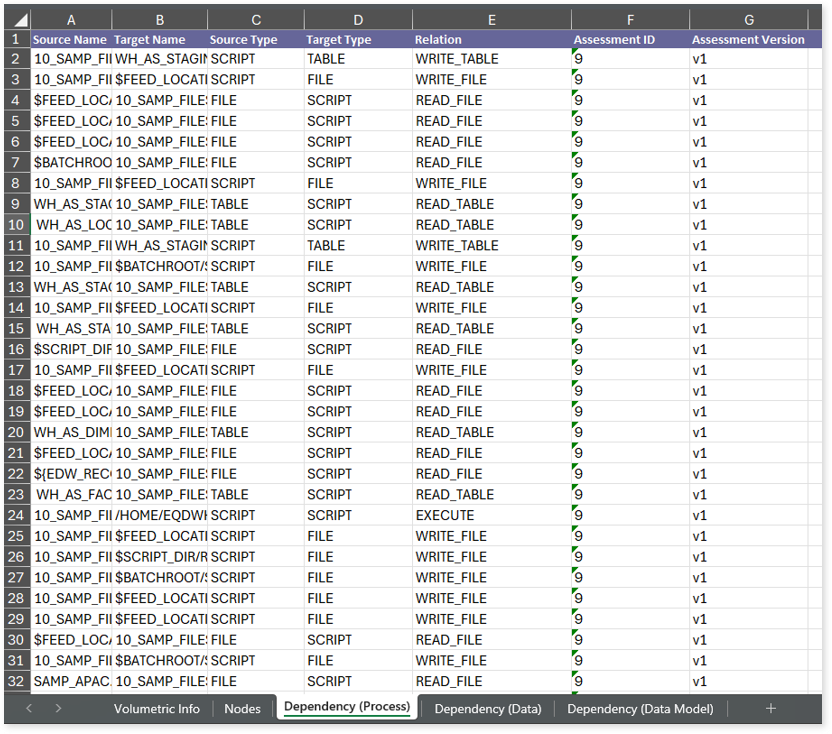
This report contains the following information:
- Volumetric Info: Provides volumetric information about the artifact types including tables, scripts, and files.
- Nodes: Lists all the source and target nodes along with their type.
- Dependency (Process): Provides information about the process lineage.
- Dependency (Data): Provides information about the data lineage.
- Dependency (Data Model): Provides dependency details about the data models.
Browse through script > shellscript folders to access all the generated CSV reports along with assessment_unparsed_files.csv.
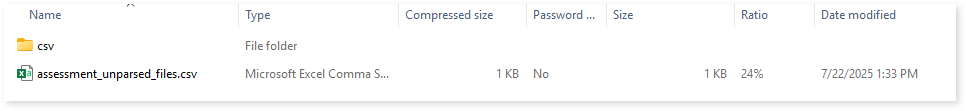
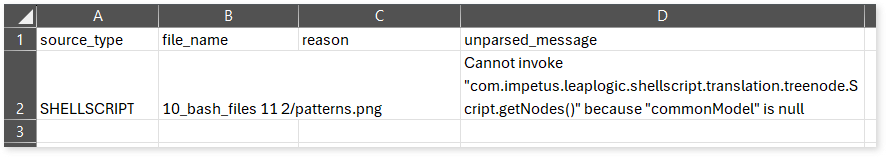
assessment_unparsed_files.csv: This report lists all the unparsed shell script along with the reason for parsing failure.
Lineage Analysis
This section provides lineage-related reports, including entity_link.csv, entity_report.csv, entity_summary.csv, link.csv, script_report.csv reports.
entity_links.csv: This report provides information about how views are connected to entities or tables and how these links extend across multiple levels. Level 1 shows the immediate table to which a view is linked. If that table is further connected to another entity, the next connection appears in Level 2, and so on.
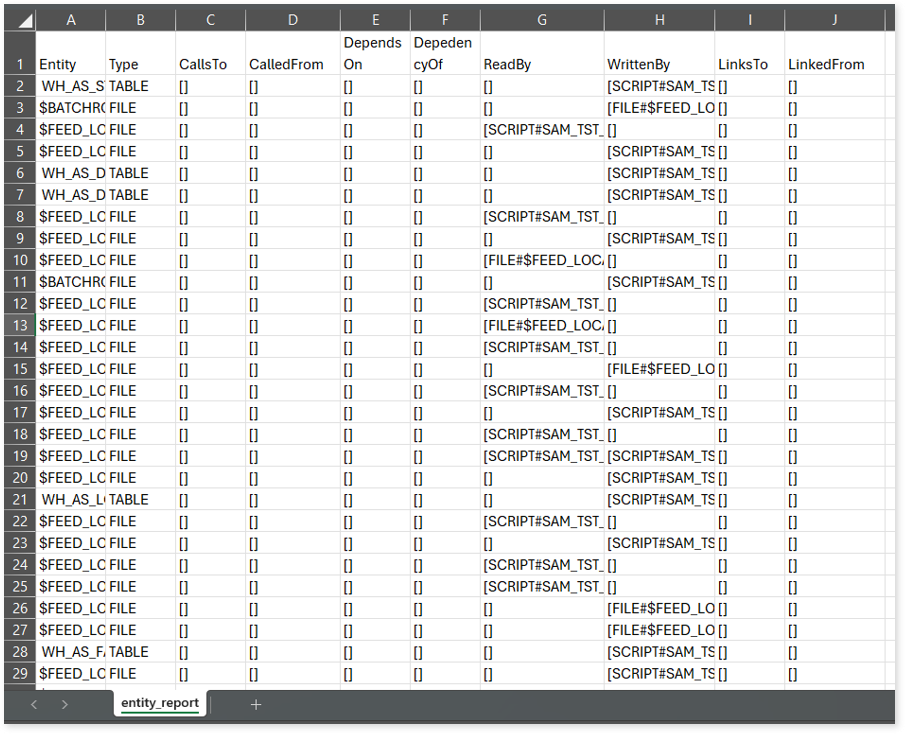
entity_report.csv: This report provides detailed lineage information for each entity within the uploaded source files. It provides a comprehensive list of all entities along with their respective types, identifies the processes, entities, or scripts that read from or write to each entity, and includes other dependency details.
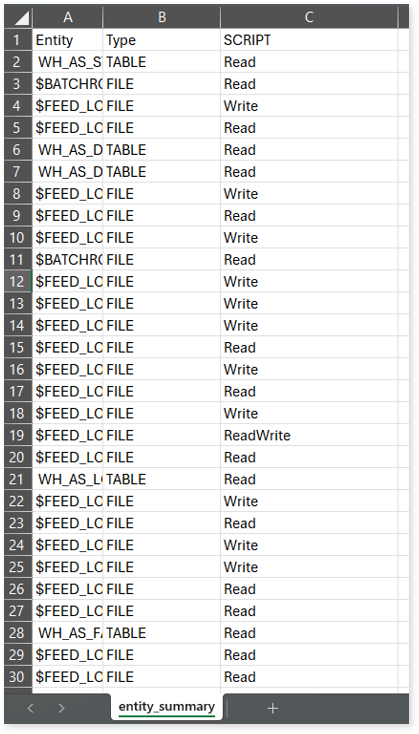
entity_summary.csv: This report provides a list of entities from uploaded source files, indicating where they appear (e.g., scripts) and the operations performed on them—Read, Write, or ReadWrite.
link.csv: This report provides information about entities linked to each view.
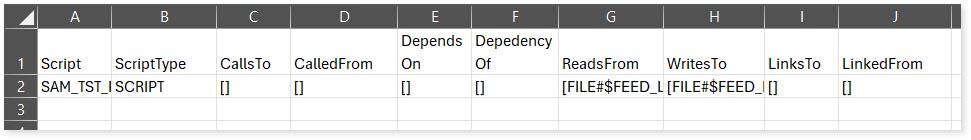
script_report.csv: This report provides detailed lineage information for each script. It lists all scripts along with their type, specifies the processes, entities, or scripts from which each script reads data and those to which it writes, as well as other dependency details.