ETL Automation Level Indicator
This topic contains detailed information on the logic used to calculate the automation level indicator of ETL sources including:
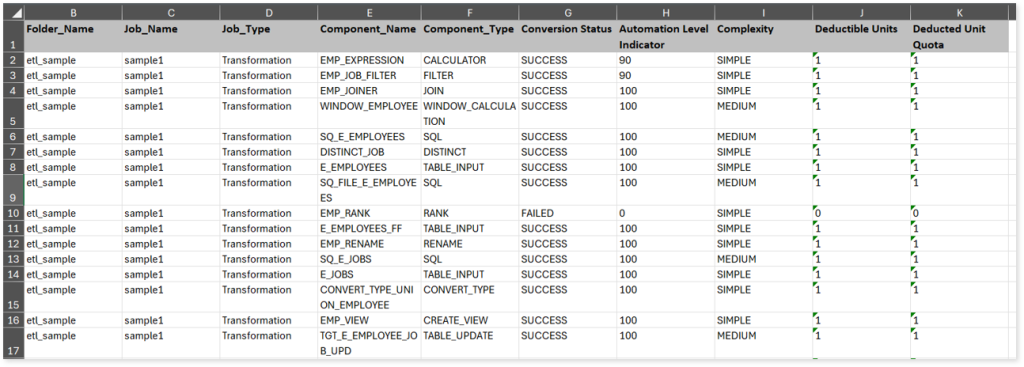
Informatica
Automation Level Indicator provides the automation conversion coverage of the Informatica ETL conversion. It is calculated based on the average of automation level indicator of all components.
Automation Level Indicator = Sum of automation level indicator of all components/ Total number of components
For instance, if there are 5 components with automation level indicator of 100%, 100%, 50%, 95%, and 100% respectively, then the automation level indicator is calculated as the average of automation level indicator of all these components. Therefore, the automation level indicator is 89% ((100 + 100 + 50 + 95 + 100)/ 5).
Next let’s see how to calculate the automation level indicator of each component.
The automation level indicator of each component is calculated based on:
- Successfully converted component: Automation level indicator of a successfully converted component is 100%.
- Failed component: Automation level indicator of a component that is failed to convert is 0%.
- Partially supported component (successfully converted components with ToDo message): Automation level indicator of a partially supported component or successfully converted component with ToDo message is 90% by default (configurable).
- Merged component (main and dependent sections): A merged component refers to a component with two sections: main and dependent, where the main section contains the core functionality and the dependent section provides additional information, input, etc., to the main section. Automation level indicator of a merged component is average of the main and dependents sections of the component. The merged components such as aggregate, union, lookup, and router have two sections – main and dependent. In such scenarios, if the main and dependent sections are successfully converted without the ToDo message, then the automation level indicator is 100%. Whereas, if the main and dependent sections are successfully converted with ToDo message, then the automation level indicator is 90%. The automation level indicator of the merged component is average of main and dependent sections.
For instance, if the main section of Lookup component is successfully converted, then the automation level indicator is 100% and if the dependent section is failed to convert, then the automation level indicator is 0%. Therefore, the automation level indicator of Lookup component is 50% (average of main and dependent sections ((100+0)/2)).
|
Component |
Main |
Dependent |
Average (Auto-conversion percentage of a merged component) |
|
aggregate1 |
100 |
90 |
95 |
|
aggregate2 |
90 |
90 |
90 |
|
union |
100 |
90 |
95 |
|
lookup |
100 |
0 |
50 |
|
router |
100 |
100 |
100 |
Matillion
Automation Level Indicator provides the automation conversion coverage of the Matillion ETL conversion. It is calculated based on the average of automation level indicator of all components.
Automation Level Indicator = Sum of automation level indicator of all components/ Total number of components
For instance, if there are 5 components with automation level indicator of 100%, 100%, 50%, 95%, and 100% respectively, then the automation level indicator is calculated as the average of automation level indicator of all these components. Therefore, the automation level indicator is 89% ((100 + 100 + 50 + 95 + 100)/ 5).
Next let’s see how to calculate the automation level indicator of each component.
The automation level indicator of each component is calculated based on:
- Successfully converted component: Automation level indicator of a successfully converted component is 100%.
- Failed component: Automation level indicator of a component that is failed to convert is 0%.
- Partially supported component (successfully converted components with ToDo message): Automation level indicator of a partially supported component or successfully converted component with ToDo message is 90% by default (configurable).
- Merged component (main and dependent sections): A merged component refers to a component with two sections: main and dependent, where the main section contains the core functionality and the dependent section provides additional information, input, etc., to the main section. Automation level indicator of a merged component is average of the main and dependents sections of the component. The merged components such as aggregate, union, router, etc., have two sections – main and dependent. In such scenarios, if the main and dependent sections are successfully converted without the ToDo message, then the automation level indicator is 100%. Whereas, if the main and dependent sections are successfully converted with ToDo message, then the automation level indicator is 90%. The automation level indicator of the merged component is average of main and dependent sections.
For instance, if the main section of Union component is successfully converted, then the automation level indicator is 100% and if the dependent section is partially supported, then the automation level indicator is 90%. Therefore, the automation level indicator of Union component is 95% (average of main and dependent sections ((100+90)/2)).
|
Component |
Main |
Dependent |
Average (Auto-conversion percentage of a merged component) |
|
aggregate1 |
100 |
0 |
50 |
|
aggregate2 |
90 |
90 |
90 |
|
union |
100 |
90 |
95 |
|
router |
100 |
100 |
100 |
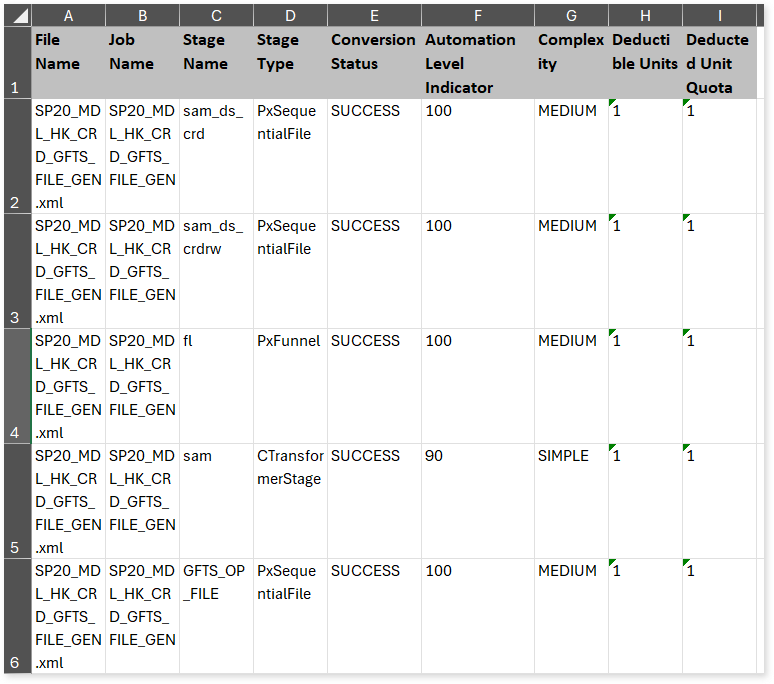
DataStage
Automation Level Indicator provides the automation conversion coverage of the DataStage ETL conversion. It is calculated based on the average of automation level indicator of all components.
Automation Level Indicator = Sum of automation level indicator of all components/ Total number of components
For instance, if there are 5 components with automation level indicator of 100%, 100%, 50%, 95%, and 100% respectively, then the automation level indicator is calculated as the average of automation level indicator of all these components. Therefore, the automation level indicator is 89% ((100 + 100 + 50 + 95 + 100)/ 5).
Next let’s see how to calculate the automation level indicator of each component.
The automation level indicator of each component is calculated based on:
- Successfully converted component: Automation level indicator of a successfully converted component is 100%.
- Failed component: Automation level indicator of a component that is failed to convert is 0%.
- Partially supported component (successfully converted components with ToDo message): Automation level indicator of a partially supported component or successfully converted component with ToDo message is 90% by default (configurable).
- Merged component (main and dependent sections): A merged component refers to a component with two sections: main and dependent, where the main section contains the core functionality and the dependent section provides additional information, input, etc., to the main section. Automation level indicator of a merged component is average of the main and dependents sections of the component. The merged components such as aggregate, union, router, etc., have two sections – main and dependent. In such scenarios, if the main and dependent sections are successfully converted without the ToDo message, then the automation level indicator is 100%. Whereas, if the main and dependent sections are successfully converted with ToDo message, then the automation level indicator is 90%. The automation level indicator of the merged component is average of main and dependent sections.
For instance, if the main section of Union component is successfully converted, then the automation level indicator is 100% and if the dependent section is partially supported, then the automation level indicator is 90%. Therefore, the automation level indicator of Union component is 95% (average of main and dependent sections ((100+90)/2)).
|
Component |
Main |
Dependent |
Average (Auto-conversion percentage of a merged component) |
|
aggregate1 |
100 |
0 |
50 |
|
aggregate2 |
90 |
90 |
90 |
|
union |
100 |
90 |
95 |
|
router |
100 |
100 |
100 |
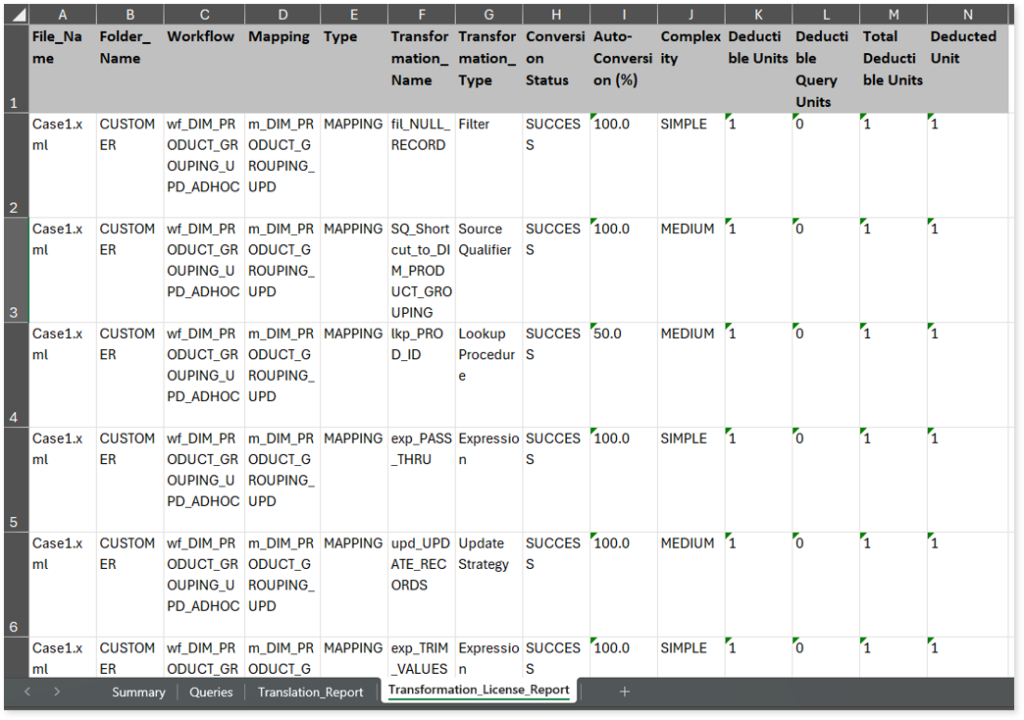
Informatica BDM
Automation Level Indicator provides the automation conversion coverage of the Informatica BDM ETL conversion. It is calculated based on the average of automation level indicator of all components.
Automation Level Indicator = Sum of automation level indicator of all components/ Total number of components
For instance, if there are 5 components with automation level indicator of 100%, 100%, 50%, 95%, and 100% respectively, then the automation level indicator is calculated as the average of automation level indicator of all these components. Therefore, the automation level indicator is 89% ((100 + 100 + 50 + 95 + 100)/ 5).
Next let’s see how to calculate the automation level indicator of each component.
The automation level indicator of each component is calculated based on:
- Successfully converted component: Automation level indicator of a successfully converted component is 100%.
- Failed component: Automation level indicator of a component that is failed to convert is 0%.
- Partially supported component (successfully converted components with ToDo message): Automation level indicator of a partially supported component or successfully converted component with ToDo message is 90% by default (configurable).
- Merged component (main and dependent sections): A merged component refers to a component with two sections: main and dependent, where the main section contains the core functionality and the dependent section provides additional information, input, etc., to the main section. Automation level indicator of a merged component is average of the main and dependents sections of the component. The merged components such as aggregate, union, router, etc., may have two sections – main and dependent. In such scenarios, if the main and dependent sections are successfully converted without the ToDo message, then the automation level indicator is 100%. Whereas, if the main and dependent sections are successfully converted with ToDo message, then the automation level indicator is 90%. The automation level indicator of the merged component is average of main and dependent sections.
For instance, if the main section of aggregate1 component is successfully converted, then the automation level indicator is 100% and if the dependent section is partially supported, then the automation level indicator is 90%. Therefore, the automation level indicator of aggregate1 component is 95% (average of main and dependent sections ((100+90)/2)).
|
Component |
Main |
Dependent |
Average (Auto-conversion percentage of a merged component) |
|
aggregate1 |
100 |
90 |
95 |
|
aggregate2 |
90 |
90 |
90 |
|
union |
100 |
0 |
50 |
|
router |
100 |
100 |
100 |
SnapLogic
Automation Level Indicator provides the automation conversion coverage of the SnapLogic ETL conversion. It is calculated based on the average of automation level indicator of all components.
Automation Level Indicator = Sum of automation level indicator of all components/ Total number of components
For instance, if there are 5 components with automation level indicator of 100%, 100%, 50%, 95%, and 100% respectively, then the automation level indicator is calculated as the average of automation level indicator of all these components. Therefore, the automation level indicator is 89% ((100 + 100 + 50 + 95 + 100)/ 5).
Next let’s see how to calculate the automation level indicator of each component.
The automation level indicator of each component is calculated based on:
- Successfully converted component: Automation level indicator of a successfully converted component is 100%.
- Failed component: Automation level indicator of a component that is failed to convert is 0%.
- Partially supported component (successfully converted components with ToDo message): Automation level indicator of a partially supported component or successfully converted component with ToDo message is 90% by default (configurable).
- Merged component (main and dependent sections): A merged component refers to a component with two sections: main and dependent, where the main section contains the core functionality and the dependent section provides additional information, input, etc., to the main section. Automation level indicator of a merged component is average of the main and dependents sections of the component. The merged components such as aggregate, union, router, etc., have two sections – main and dependent. In such scenarios, if the main and dependent sections are successfully converted without the ToDo message, then the automation level indicator is 100%. Whereas, if the main and dependent sections are successfully converted with ToDo message, then the automation level indicator is 90%. The automation level indicator of the merged component is average of main and dependent sections.
For instance, if the main section of Union component is successfully converted, then the automation level indicator is 100% and if the dependent section is failed to convert, then the automation level indicator is 0%. Therefore, the automation level indicator of Union component is 50% (average of main and dependent sections ((100+0)/2)).
|
Component |
Main |
Dependent |
Average (Auto-conversion percentage of a merged component) |
|
aggregate1 |
100 |
90 |
95 |
|
aggregate2 |
90 |
90 |
90 |
|
union |
100 |
0 |
50 |
|
router |
100 |
100 |
100 |
IICS
Automation Level Indicator provides the automation conversion coverage of the IICS ETL conversion. It is calculated based on the average of automation level indicator of all components.
Automation Level Indicator = Sum of automation level indicator of all components/ Total number of components
For instance, if there are 5 components with automation level indicator of 100%, 100%, 50%, 95%, and 100% respectively, then the automation level indicator is calculated as the average of automation level indicator of all these components. Therefore, the automation level indicator is 89% ((100 + 100 + 50 + 95 + 100)/ 5).
Next let’s see how to calculate the automation level indicator of each component.
The automation level indicator of each component is calculated based on:
- Successfully converted component: Automation level indicator of a successfully converted component is 100%.
- Failed component: Automation level indicator of a component that is failed to convert is 0%.
- Partially supported component (successfully converted components with ToDo message): Automation level indicator of a partially supported component or successfully converted component with ToDo message is 90% by default (configurable).
- Merged component (main and dependent sections): A merged component refers to a component with two sections: main and dependent, where the main section contains the core functionality and the dependent section provides additional information, input, etc., to the main section. Automation level indicator of a merged component is average of the main and dependents sections of the component. The merged components such as aggregate, union, router, etc., have two sections – main and dependent. In such scenarios, if the main and dependent sections are successfully converted without the ToDo message, then the automation level indicator is 100%. Whereas, if the main and dependent sections are successfully converted with ToDo message, then the automation level indicator is 90%. The automation level indicator of the merged component is average of main and dependent sections.
For instance, if the main section of aggregate1 component is successfully converted, then the automation level indicator is 100% and if the dependent section is partially supported, then the automation level indicator is 90%. Therefore, the automation level indicator of aggregate1 component is 95% (average of main and dependent sections ((100+90)/2)).
|
Component |
Main |
Dependent |
Average (Auto-conversion percentage of a merged component) |
|
aggregate1 |
100 |
90 |
95 |
|
aggregate2 |
90 |
90 |
90 |
|
union |
100 |
0 |
50 |
|
router |
100 |
100 |
100 |
Ab Initio
Automation Level Indicator provides the automation conversion coverage of the Ab Initio ETL conversion. It is calculated based on the average of automation level indicator of all components.
Automation Level Indicator = Sum of automation level indicator of all components/ Total number of components
For instance, if there are 5 components with automation level indicator of 100%, 100%, 0%, 85%, and 82% respectively, then the automation level indicator is calculated as the average of automation level indicator of all these components. Therefore, the automation level indicator is 73.4% ((100 + 100 + 0 + 85 + 82)/ 5).
Next let’s see how to calculate the automation level indicator of each component.
The automation level indicator of each component is calculated based on:
Automation Level Indicator of each component = Automation Base Percent + (100 – Automation Base Percent) * Supported Properties Count / Total Properties
By default, the automation base percentage for a component is 75% (configurable) if the component is auto-converted successfully. The remaining 25% is calculated based on the conversion support of properties in the graphs. For instance:
- If you have 10 properties for a particular component and all the 10 properties are auto-converted successfully, then the automation level indicator is calculated as the Automation Base Percent + (100 – Automation Base Percent) * Supported Properties Count / Total Properties; i.e, 75+ (100-75)*10/10 = 100%
- If you have 10 properties for a particular component and only 5 properties are auto-converted, then automation level indicator is calculated as the Automation Base Percent + (100 – Automation Base Percent) * Supported Properties Count / Total Properties; i.e., 75+(100-75)*5/10=87.5%
SSIS
Automation Level Indicator provides the automation conversion coverage of the SSIS ETL conversion. It is calculated based on the average of automation level indicator of all components.
Automation Level Indicator = Sum of automation level indicator of all components/ Total number of components
For instance, if there are 5 components with automation level indicator of 100%, 100%, 0%, 85%, and 82% respectively, then the automation level indicator is calculated as the average of automation level indicator of all these components. Therefore, the automation level indicator is 73.4% ((100 + 100 + 0 + 85 + 82)/ 5).
Next let’s see how to calculate the automation level indicator of each component.
The automation level indicator of each component is calculated based on:
Automation Level Indicator of each component = Automation Base Percent + (100 – Automation Base Percent) * Supported Properties Count / Total Properties
By default, the automation base percentage for a component is 75% if the component is auto-converted successfully. The remaining 25% is calculated based on the conversion support of properties in the graphs. For instance:
- If you have 10 properties for a particular component and all the 10 properties are auto-converted successfully, then the automation level indicator is calculated as the Automation Base Percent + (100 – Automation Base Percent) * Supported Properties Count / Total Properties; i.e, 75+ (100-75)*10/10 = 100%
- If you have 10 properties for a particular component and only 5 properties are auto-converted, then automation level indicator is calculated as the Automation Base Percent + (100 – Automation Base Percent) * Supported Properties Count / Total Properties; i.e., 75+(100-75)*5/10=87.5%
Talend
Automation Level Indicator provides the automation conversion coverage of the Talend ETL conversion. It is calculated based on the average of automation level indicator of all components.
Automation Level Indicator = Sum of automation level indicator of all components/ Total number of components
For instance, if there are 5 components with automation level indicator of 100%, 100%, 0%, 85%, and 82% respectively, then the automation level indicator is calculated as the average of automation level indicator of all these components. Therefore, the automation level indicator is 73.4% ((100 + 100 + 0 + 85 + 82)/ 5).
Next let’s see how to calculate the automation level indicator of each component.
The automation level indicator of each component is calculated based on:
Automation Level Indicator of each component = Automation Base Percent + (100 – Automation Base Percent) * Supported Properties Count / Total Properties
By default, the automation base percentage for a component is 75% if the component is auto-converted successfully. The remaining 25% is calculated based on the conversion support of properties in the graphs. For instance:
- If you have 10 properties for a particular component and all the 10 properties are auto-converted successfully, then the automation level indicator is calculated as the Automation Base Percent + (100 – Automation Base Percent) * Supported Properties Count / Total Properties; i.e, 75+ (100-75)*10/10 = 100%
- If you have 10 properties for a particular component and only 5 properties are auto-converted, then automation level indicator is calculated as the Automation Base Percent + (100 – Automation Base Percent) * Supported Properties Count / Total Properties; i.e., 75+(100-75)*5/10=87.5%
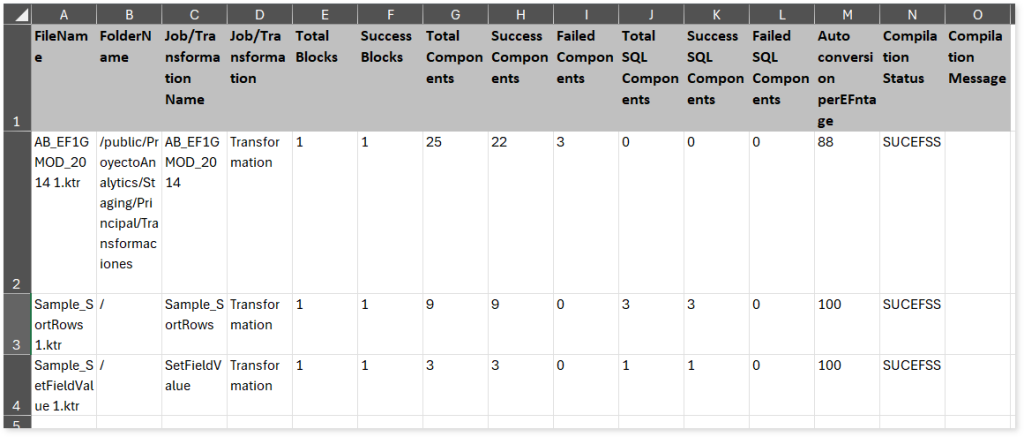
Pentaho
Automation level indicator provides the automation conversion coverage of the Pentaho ETL conversion. It is calculated based on the average of automation level indicator of jobs and transformations.
Automation Level Indicator = Sum of auto conversion percentage all jobs and transformations / total number of jobs and transformations
For instance, if you have three jobs or transformations with 88%, 100%, and 100% auto-conversion percentage respectively. Then the overall automation level indicator is calculated as sum of auto conversion percentage all jobs and transformations / total number of jobs and transformations, i.e., 88+100+100/3 = 96%.
Next, let’s see how to calculate the automation level indicator of each job or transformation.
The automation level indicator of each job or transformation is calculated based on the average of successfully converted components in the job/ transformation.
Automation Level Indicator of a job/ transformation = (Number of successfully converted components / total number of components) * 100
For instance, if there are 25 components, out of which 22 components are successfully converted to target equivalent, then the Automation Level Indicator is calculated as (Number of successfully converted components/ Total number components) * 100; i.e., (22/25) * 100 = 88%