Tableau to Looker Conversion Report
This topic provides a comprehensive report of the Tableau to Looker conversion along with a detailed report of its execution stage.
In This Topic:
BI Conversion Report
This topic provides a comprehensive report of Tableau BI objects that are transformed to Looker equivalent BI objects.
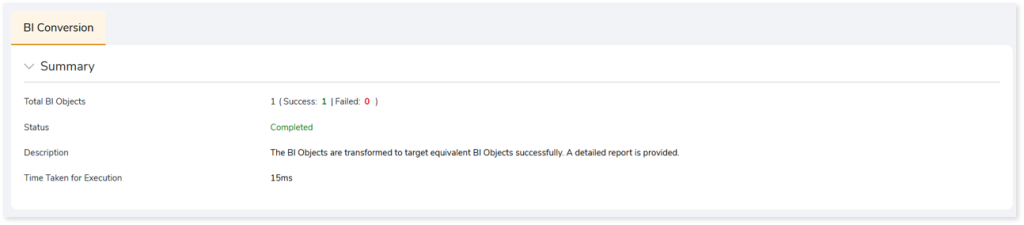
- Total BI Objects: Displays the number of BI objects. It also gives a segregated view of successfully converted objects and failed objects.
- Status: Provides status of the BI Conversion stage.
- Description: A brief description of the stage is displayed.
- Time Taken for Execution: The time taken for conversion.
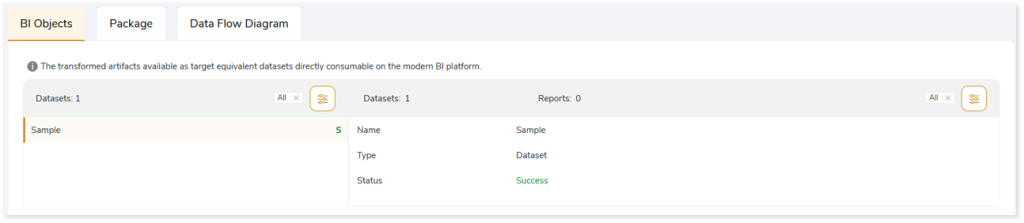
BI Objects
This section shows transformed artifacts containing datasets and reports. The left panel lists all the transformed artifacts along with its conversion status. The right panel shows information about datasets and reports within the artifact. It includes information about its type, status, and remarks. Remarks displays an error message if the dataset or report fails to convert. It helps you understand the error and guides you to fix it.
Package
This section provides the converted artifacts which can be executed directly on the target platform. Select  to download the converted artifacts for offline use.
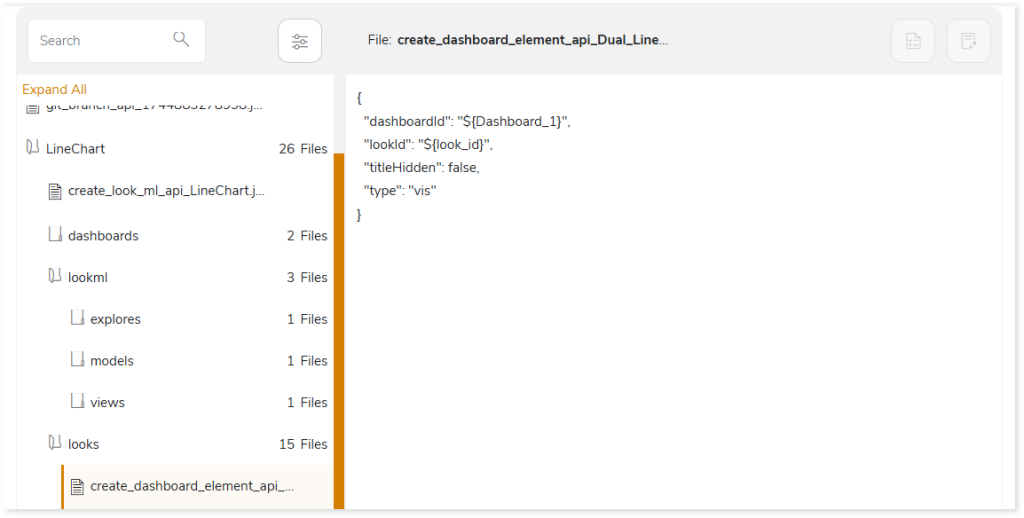
Here, you can see the Looker equivalent artifacts which include connection (created when the Use Existing Database Connection toggle is turned off in BI configuration page), project, git branch, and updated project (required to update the git in the project) APIs along with the converted looks (visuals) artifacts.
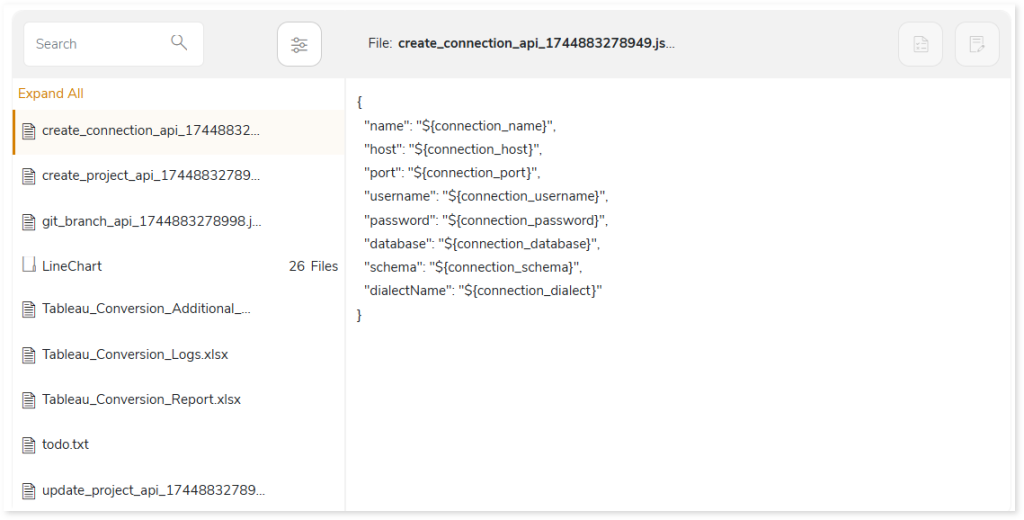
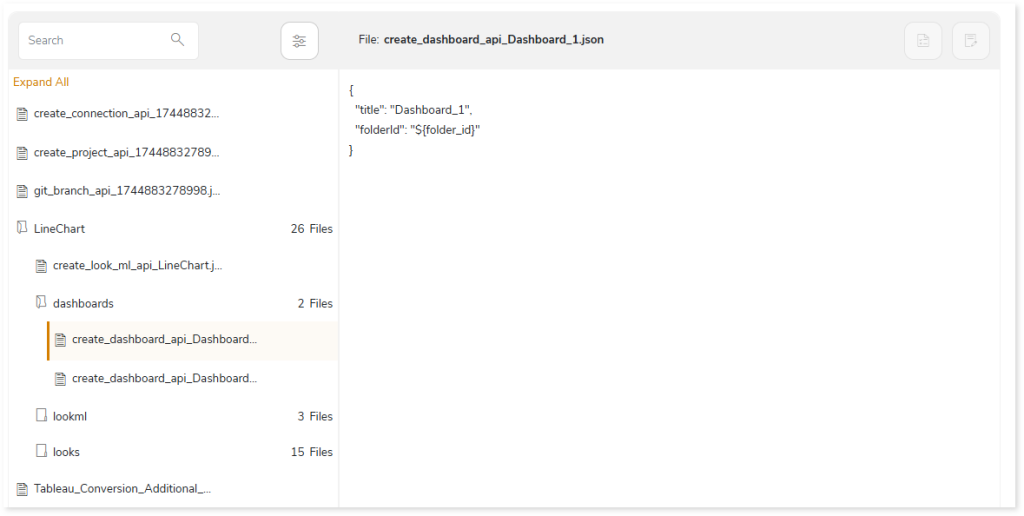
The converted looks artifact (LineChart folder) contains three folders: dashboards, lookml, and looks.
- In the dashboards folder, you can see all the dashboards that are converted to the target equivalent.
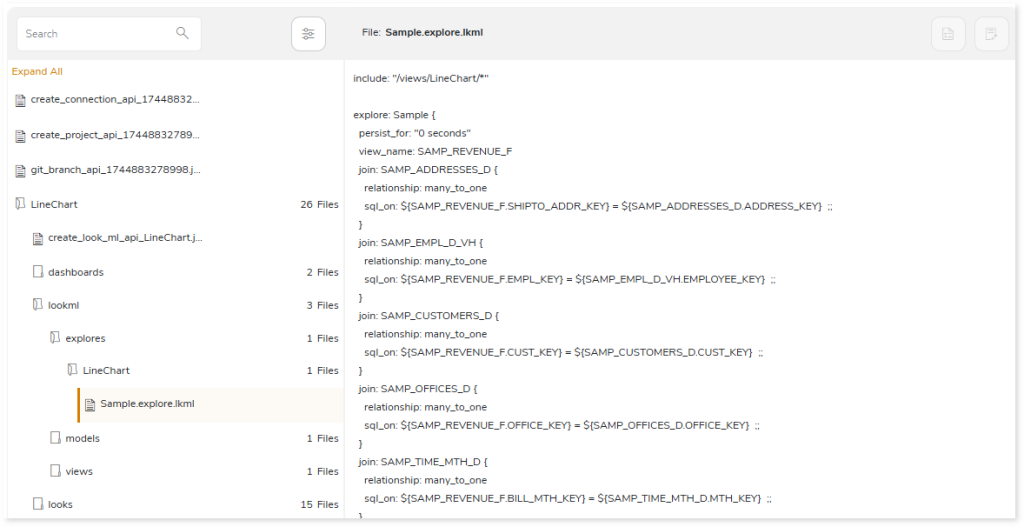
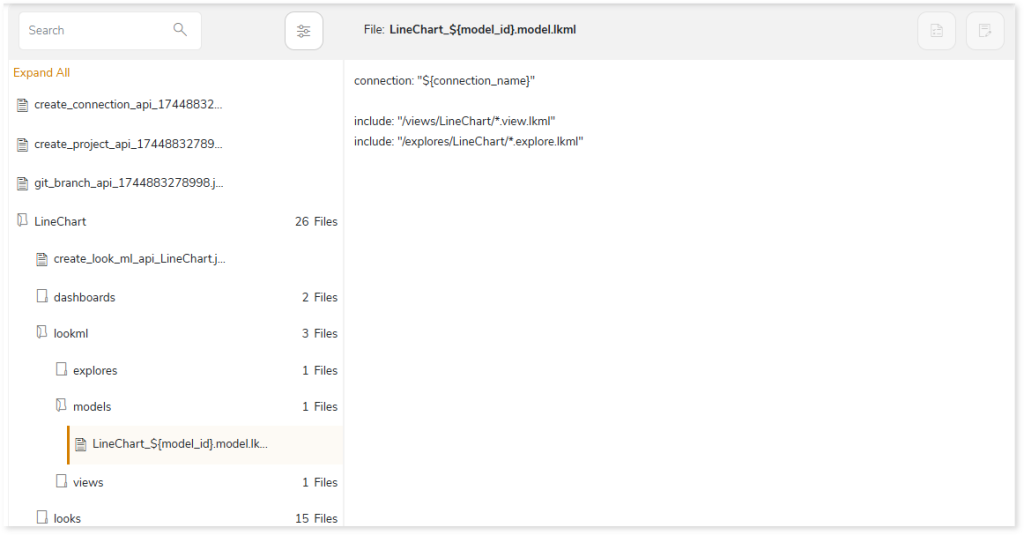
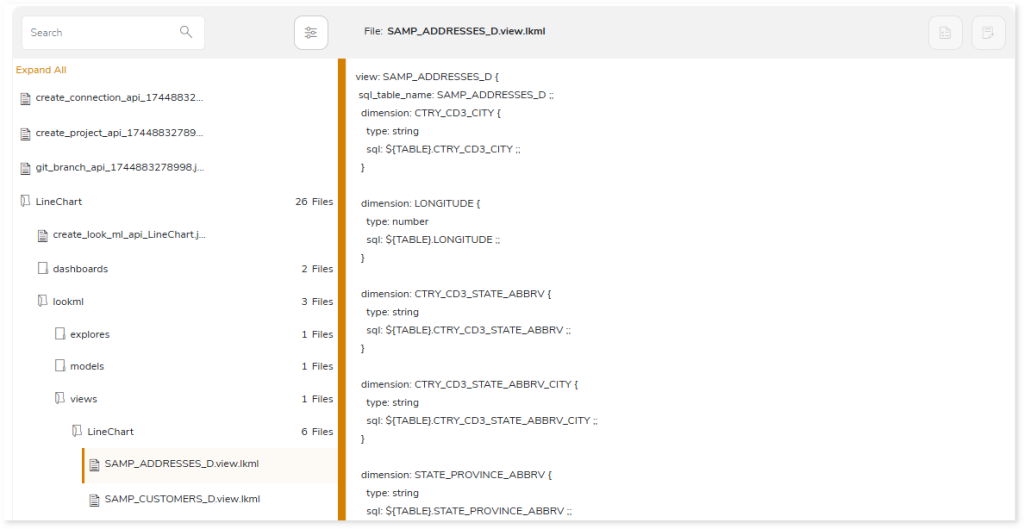
- The lookml folder contains three types of lookml files: explores, model, and view.
- The explores.lkml file contains information about the relationship between views.
- The model.lkml file contains the connection details of the database.
- The views.lkml files contain table details used in the dataset.
In the looks folder, you can see all the converted looks or visuals such as line discreate graph, dual line graph, etc.
In addition, you can access the Tableau_Conversion_Additional_Help.xlsx, Tableau_Conversion_Logs.xlsx, and todo.txt reports, each offering detailed error specifications and troubleshooting information to help you quickly detect and resolve issues during code transformation.
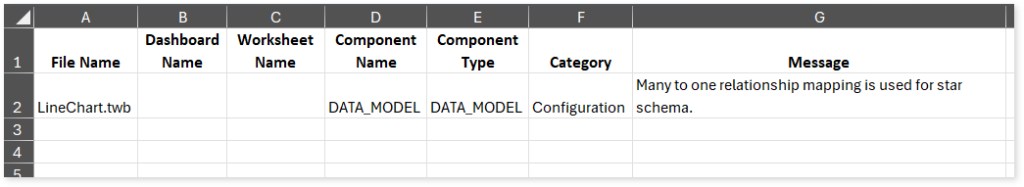
- The Tableau_Conversion_Additional_Help.xlsx report contains a detailed error specifications generated during the transformation process. Error specifications include:
- Error messages with clear explanations for quick issue resolution.
- Unsupported components or properties that cannot be auto converted and LeapLogic has not implemented alternative logic or methods for conversion.
- Technical limitations that prevent the conversion of certain properties or components.
- Partially supported components
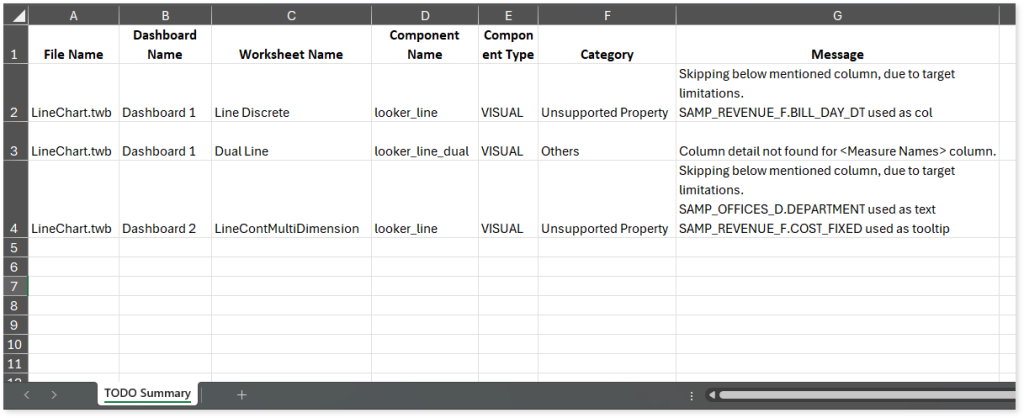
- The Tableau_Conversion_Logs.xlsx report contains information about the components or properties that are not supported in target environment and require manual intervention for successful conversion. In such cases, LeapLogic has implemented alternative logic or methods to convert the source components or properties to the target-equivalent.
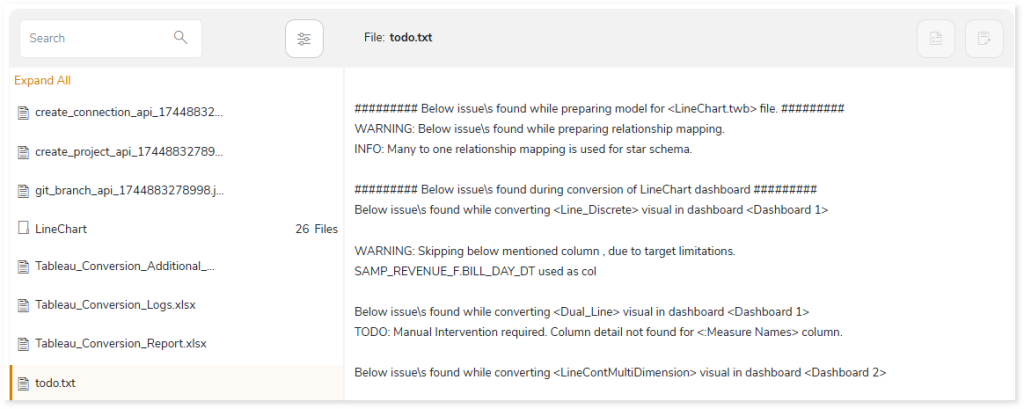
- The todo.txt report contains all error messages and issues encountered during code transformation. It includes warnings, errors, alerts, and informational messages to guide further actions for the successful conversion of components or properties to the target equivalent.
In the Package section you can also see a Tableau_Conversion_Report.xlsx report which provides detailed information about the Tableau conversion including the number of total, failed, successfully transformed charts, visual objects, calculations, filters, and more. It also includes information about the automation level indicator along with deductible and deducted script quota.
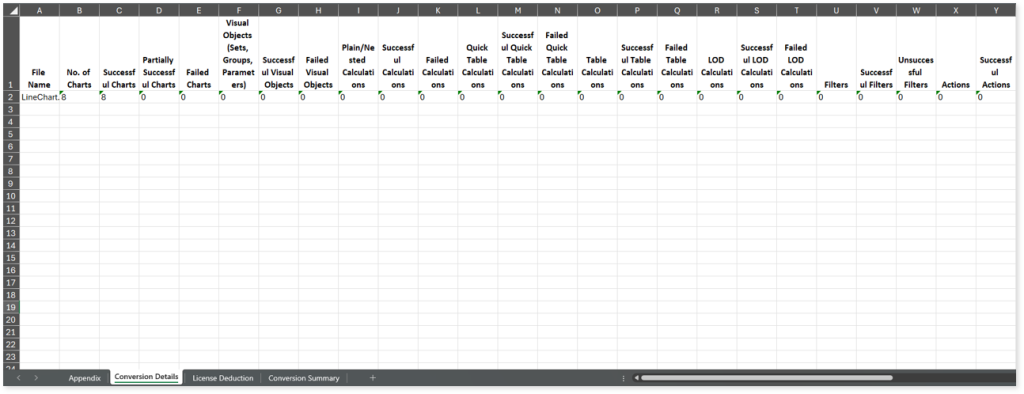
This report contains the following information:
- Appendix: Provides information about the weightage of each component used to calculate the conversion automation percentage.
- Conversion Details: Provides information about the number of total, failed, successfully transformed charts, visual objects, calculations, filters, etc., along with the conversion automation percentage.
- License Deduction: Provides information about deductible script quota (the quota that needs to be deducted) and deducted script quota (the actual script quota deducted from the license).
- Conversion Summary: Provides the overall conversion automation percentage, i.e., the automation percentage calculated across all scripts.
To know more about the logic used to calculate the automation level indicator of Tableau conversion, refer BI Automation Level Indicator.
Execution Report
The Execution report provides information about the execution of transformed Tableau reports.
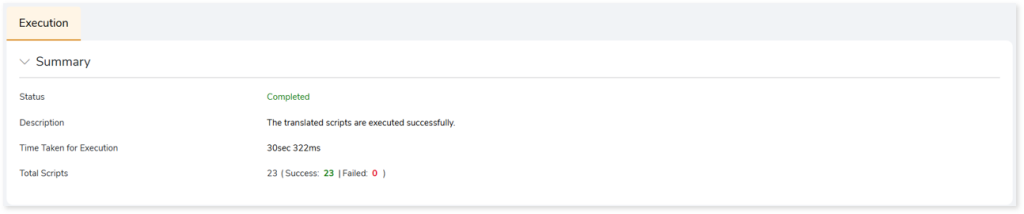
- Status: Status of the Execution stage.
- Description: Description of the Execution stage.
- Time Taken for Execution: Time taken to execute the transformed scripts.
- Total Scripts: The total number of scripts used in the Execution stage.
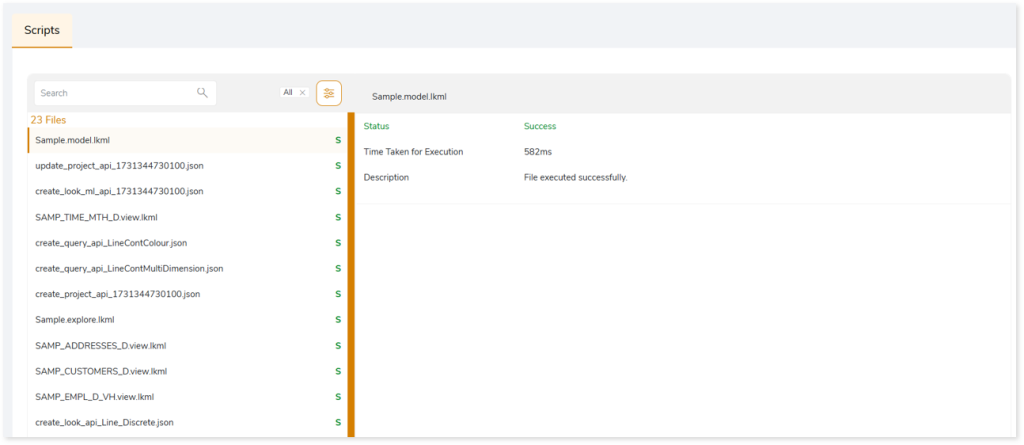
Scripts
This topic lists all the transformed artifacts that have been executed. The left panel lists the scripts along with its execution status. The right panel shows information of the selected script. It includes execution status, time taken for execution and description.