SSRS Assessment Report
This topic contains information about the SSRS assessment report. The assessment assesses the SSRS workloads and produces in-depth insights that help to plan the migration. The input formats for SSRS assessment are RDS, RSD, and RDL.
In This Topic:
Highlights
The highlights section gives you a high-level overview of your assessment summary of the analytics performed on the selected workloads. It includes visualizations, parameters, filters, and columns of the files used.
Summary
This section provides an overview of input source files and the associated workload inventory including files, data sources, datasets, visualizations, and more.
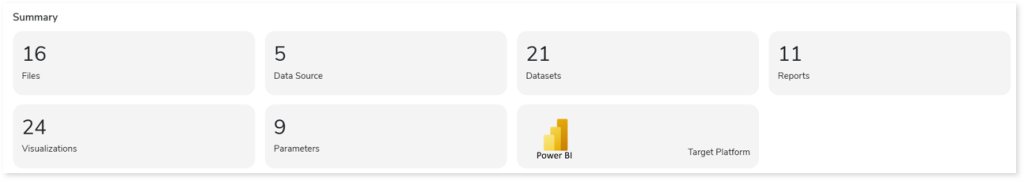
- Files: Displays the number of files.
- Data Sources: Displays the number of data sources.
- Datasets: Displays the number of datasets present in the files.
- Reports: Displays the number of reports in the files.
- Visualizations: Displays the number of visuals such as pie charts, heat maps, clustered column graphs, and more in reports.
- Parameters: Displays the number of parameters in the reports.
- Target Platform: Displays the name of the target platform.
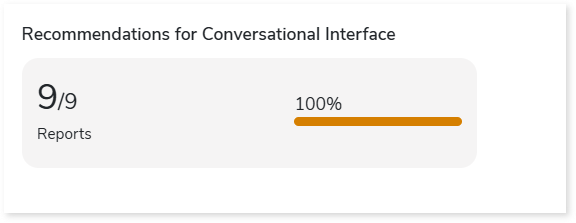
Recommendations for Conversational Interface
This section displays the number of reports recommended for the conversational interface. These insights help optimize scope and cost.
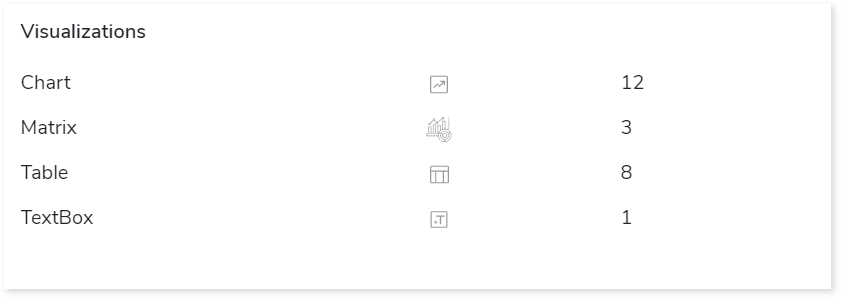
Visualizations
This section displays the graphical visualizations used in the reports such as charts, matrixes, tables, text boxes, etc.
Parameters
This section provides details about the report and query parameters.
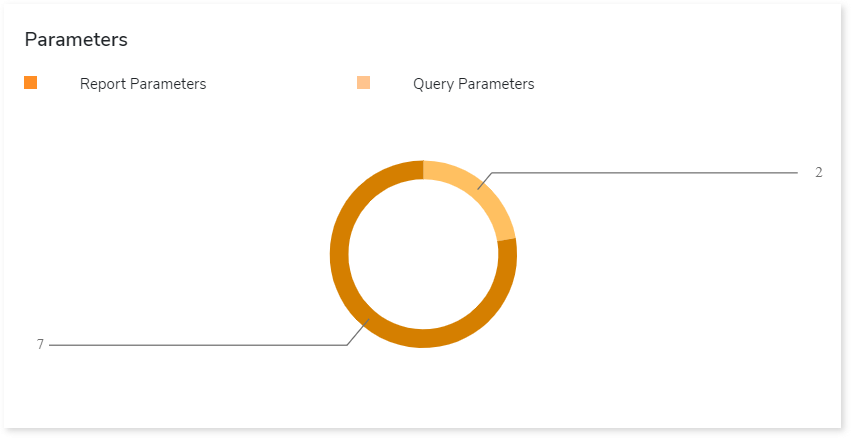
- Report Parameters: Refers to parameters present in reports that are used to filter the data.
- Query Parameters: Refers to a defined set of parameters to retrieve or fetch data from the database.
Filters
This section provides information about filters including dataset and report filters. It is a process of filtering out the data to minimize the data set size, remove irrelevant records, etc.
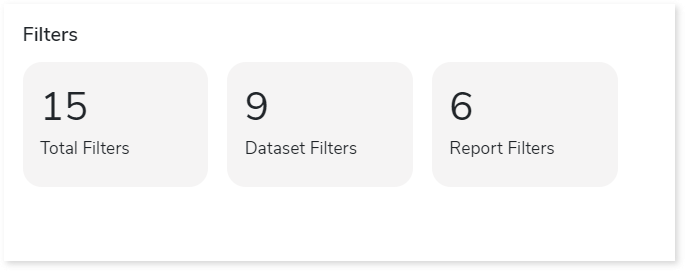
- Total Filters: Displays the total number of filters.
- Dataset Filters: Displays the number of dataset filters that are applied to the datasets.
- Report Filters: Displays the number of report filters that are applied to the reports.
Columns
This section provides details about the columns in the entities including the total number of columns and number of calculated columns.
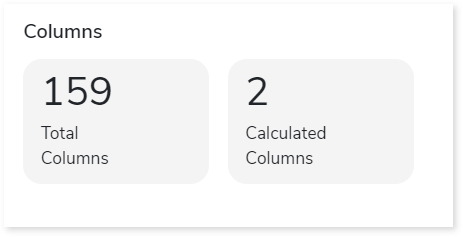
- Total Columns: Total number of columns available in the entities.
- Calculated Columns: Columns in which functions or operations such as min, max, sum, avg, etc. are implemented for calculation.
Analysis
This topic provides a detailed examination of source files, datasets, reports, and parameters.
Files
This section provides a comprehensive report of the source file including statistical information about datasets, data sources, columns, and queries.
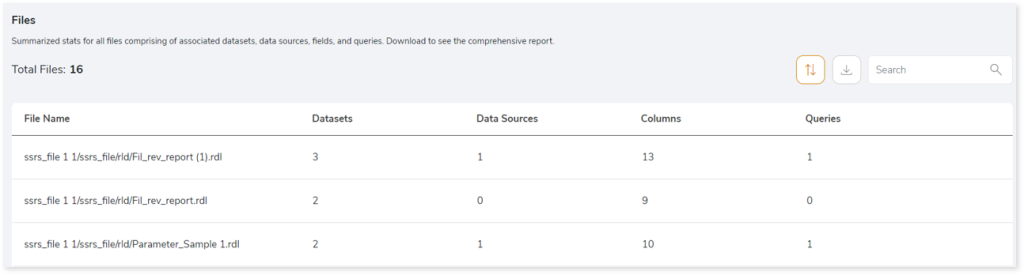
- File Name: Displays the name of the file.
- Datasets: Displays the number of datasets in the file.
- Data Sources: Displays the number of data sources in the file.
- Columns: Displays the number of columns in the file.
- Queries: Displays the number of queries.
Datasets
This section provides details about the datasets including dataset types, columns, filters, and more.
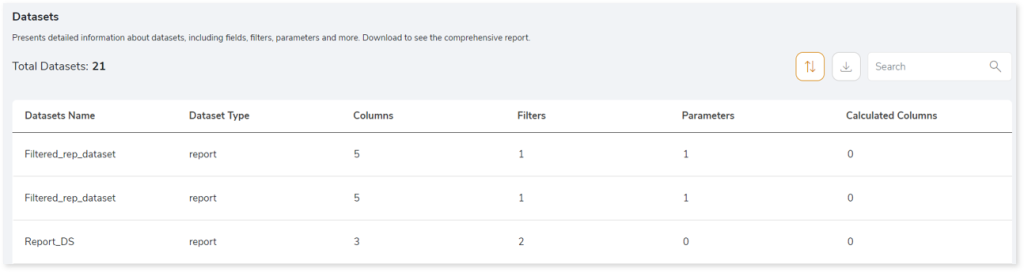
- Datasets Name: Displays the dataset name.
- Dataset Type: Displays dataset types such as shared, embedded, and report.
- Shared: Refers to a dataset that is published or defined on a report server. This dataset is used across multiple reports on the same server.
- Embedded: Refers to a dataset defined within a specific report. This dataset is used only in that specific report.
- Report: The report dataset does not contain data; instead, it defines a reference point to the shared dataset that needs to be used in the report.
- Columns: Displays the number of associated columns.
- Filters: Displays the number of filters in each dataset.
- Parameters: Displays the number of parameters in each dataset.
- Calculated Columns: Displays the number of calculated columns.
Reports
This section provides details about reports including visualization objects, parameters, and filters.
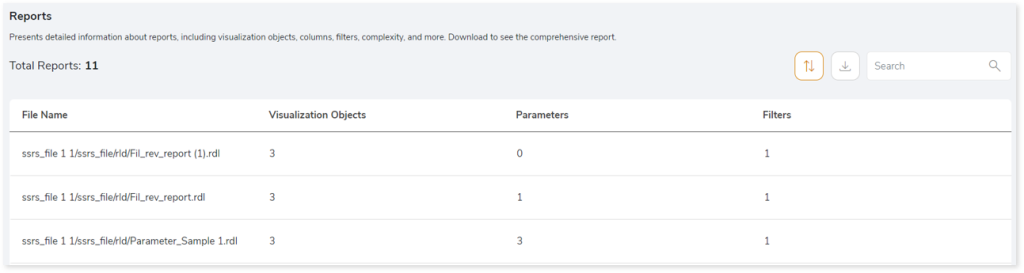
- File Name: Displays the file name.
- Visualization Objects: Displays the number of visualization objects in each file.
- Parameters: Displays the number of parameters in each file.
- Filters: Displays the number of filters in each file.
Parameters
This section provides details about parameters including its types, datasets, and associated files.
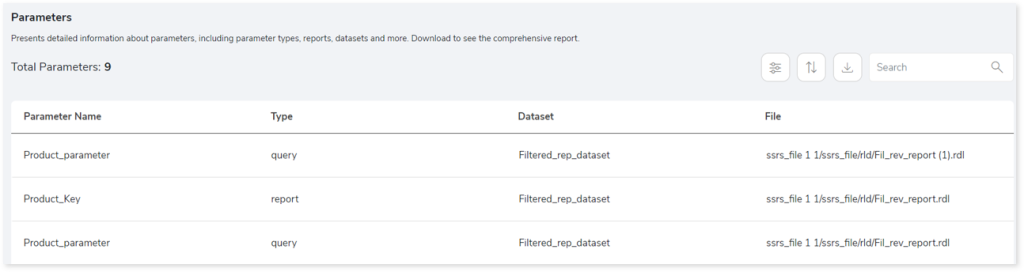
- Parameter Name: Displays the name of the parameter.
- Type: Displays the parameter types such as query or report.
- Report Parameters: Refers to parameters present in reports that are used to filter the data.
- Query Parameters: Refers to a defined set of parameters to retrieve or fetch data from the database.
- Dataset: Displays the dataset associated with each parameter.
- File: Displays the file path where the parameter is present.
Lineage
End-to-end data and process lineage identify the complete dependency structure through interactive and drill-down options to the last level.
Typically, even within one line of business, multiple data sources, entry points, ETL tools, and orchestration mechanisms exist. Decoding this complex data web and translating it into a simple visual flow can be extremely challenging during large-scale modernization programs. The visual lineage graph adds tremendous value and helps define the roadmap to the modern data architecture. It deep dives into all the existing flows, like Autosys jobs, applications, ETL scripts, BTEQ/Shell (KSH) scripts, procedures, input and output tables, and provides integrated insights. These insights help data teams make strategic decisions with greater accuracy and completeness. Enterprises can proactively leverage integrated analysis to mitigate the risks associated with migration and avoid business disruption.
Now, let’s see how you can efficiently manage lineage.
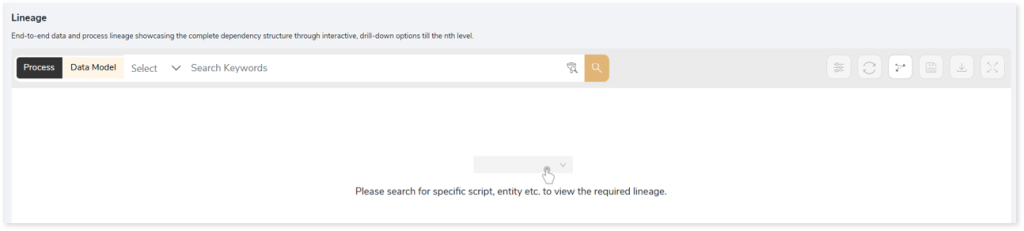
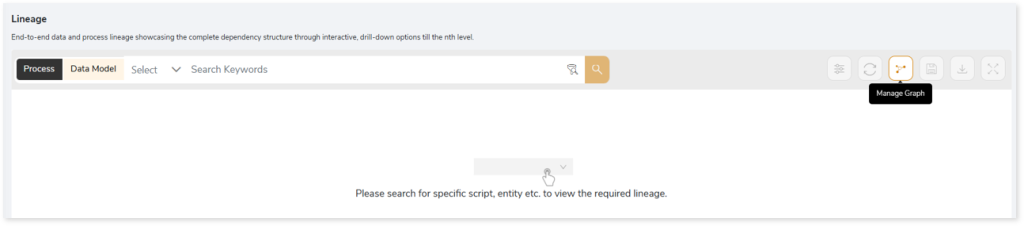
To view the required lineage:
- Select the Process or Data Model tab.
- Enter the keywords in the Search Keywords field. Else, simply select the reports, entities, or databases from the Search dropdown.
- Click the Search icon to generate the lineage.
Lineage helps you understand dependencies across processes and data model:
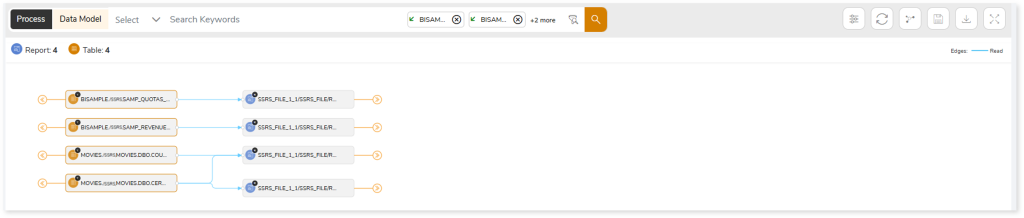
- Process lineage illustrates the dependencies between two or more processes such as entities and reports.
- Data model shows the end-to-end relationships and dependencies between elements (databases, entities, reports).
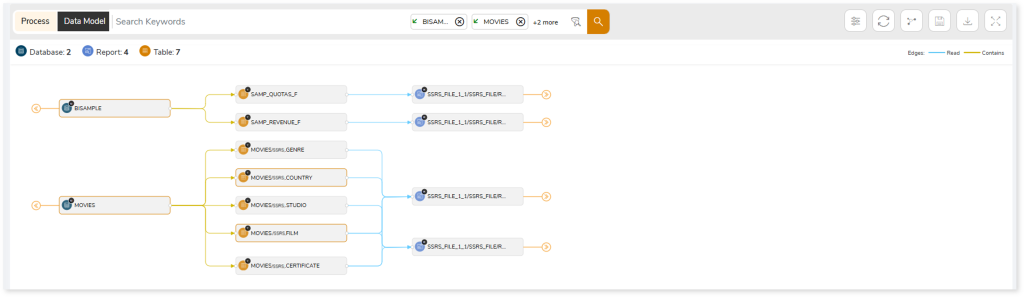
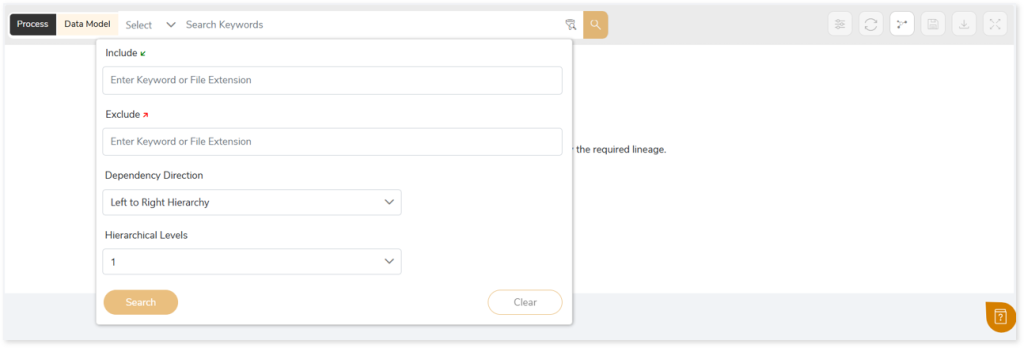
In addition, the filter search icon allows you to include or exclude particular nodes to obtain the required dependency structure. You can also choose the direction of the lineage. By default, the Dependency Direction is Left to Right Hierarchy. You can also choose Right to Left Hierarchy or Bidirectional dependency directions as required. Moreover, you can also increase the Hierarchy Levels to nth level.
Lineage facilitates you visualize how your selected nodes are connected and depend on each other. The nodes and their connecting edges (relationships) help you to understand the overall structure and dependencies.
|
Nodes |
Edges |
 Column Column |
 Call Call |
 Report Report |
 Reads Reads |
 Tables Tables |
 Write Write |
|
|
 Execute Execute |
|
|
 Others Others |
|
|
 Contains Contains |
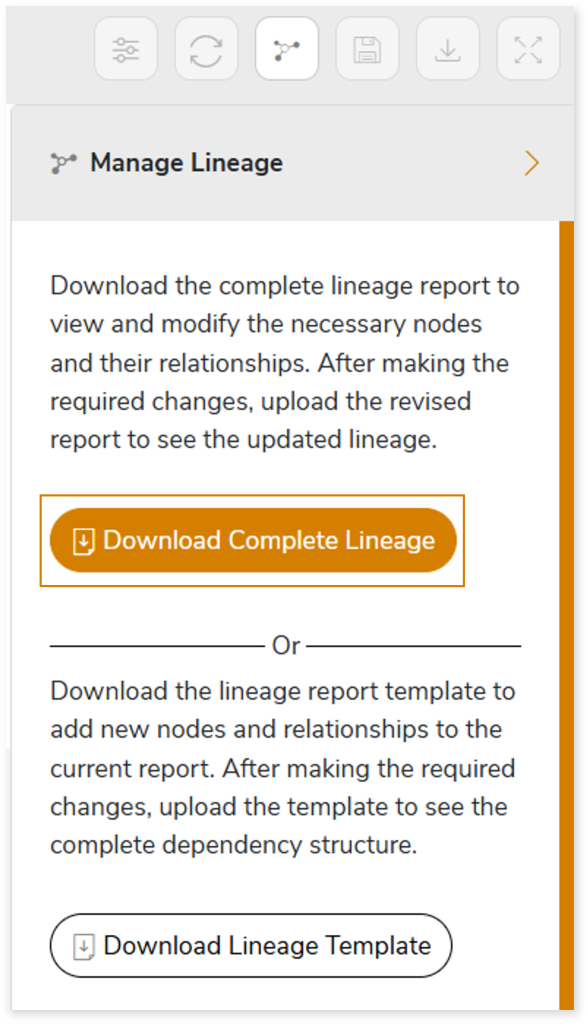
Manage Lineage
This feature enables you to view and manage your lineage. You can add, modify, or delete nodes and their relationships to generate an accurate representation of the required dependency structure. There are two ways to update the lineage: either using Complete Lineage report or Lineage Template.
Using Complete Lineage report
Follow the below steps to modify the lineage:
- Click the Manage Graph icon.
- Click Download Complete Lineage to update, add, or delete the nodes and their relationships in the current lineage.
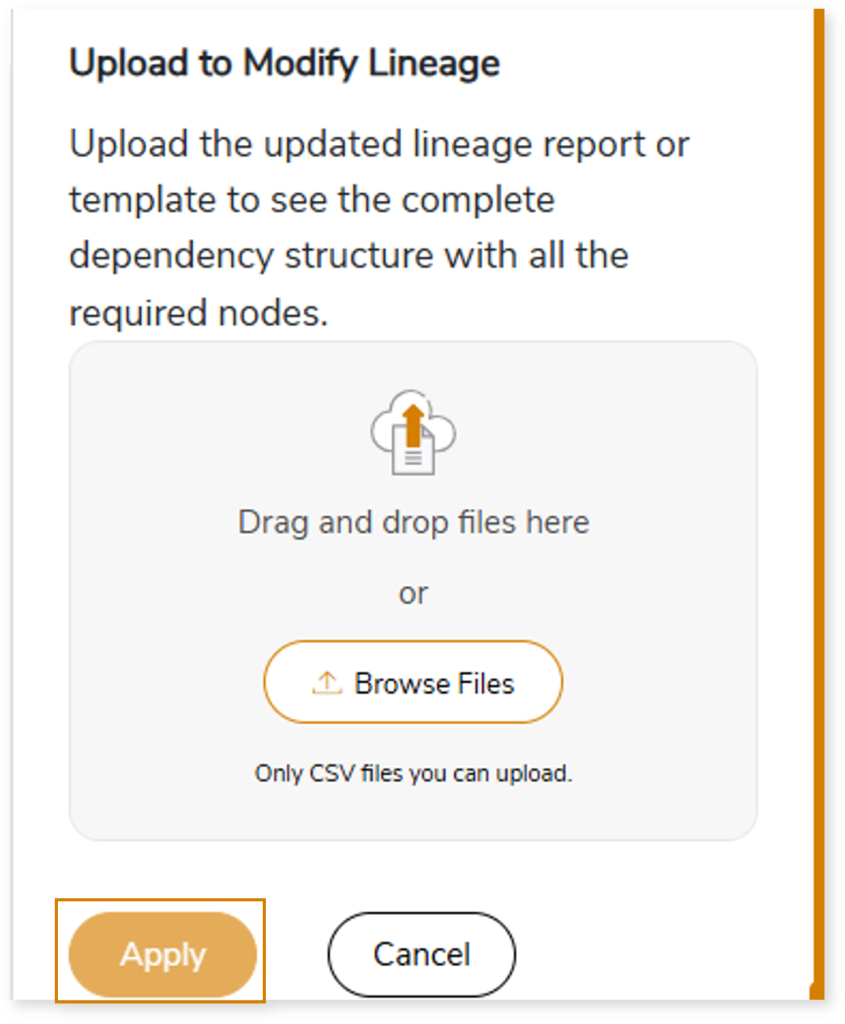
- Once the complete lineage report is downloaded, you can make necessary updates such as updating, deleting or adding the nodes and its relationships.
- After making the required changes, upload the updated lineage report in Upload to Modify Lineage.
- Click Apply to incorporate the updates into the dependency structure.
- Generate the required process or data lineage.
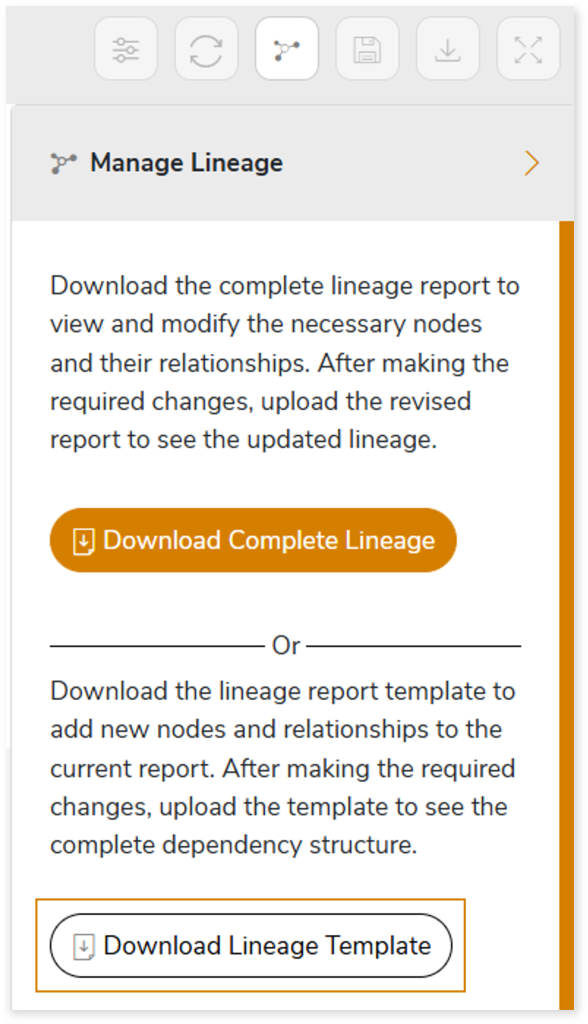
Using Lineage Template
Follow the below steps to add new nodes and their relationships to the current lineage report:
- Click the Manage Graph icon.

- Click Download Lineage Template.
- Once the lineage template is downloaded, you can add new nodes and relationships in the template.
- After making the required changes, upload the template in Upload to Modify Lineage.
- Click Apply to incorporate the updates into the complete dependency structure.
- Generate the required process or data lineage.

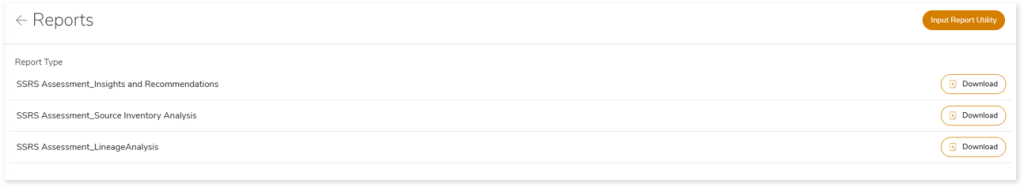
Downloadable Reports
Downloadable reports allow you to export detailed SSRS assessment reports of your source data which enables you to gain in-depth insights with ease. To access these assessment reports, click Reports.

Types of Reports
In the Reports section, you can see various types of reports such as Insights and Recommendations, Source Inventory Analysis, and Lineage Analysis. Each report type offers detailed information allowing you to explore your assessment results.
Insights and Recommendations
This report provides an in-depth insight into the source input files. It contains the final output including information about reports and datasets.
Here, you can see the sql folder along with query_details_db.csv, shared_datasource_connection.csv, and SSRS Report.xlsx.
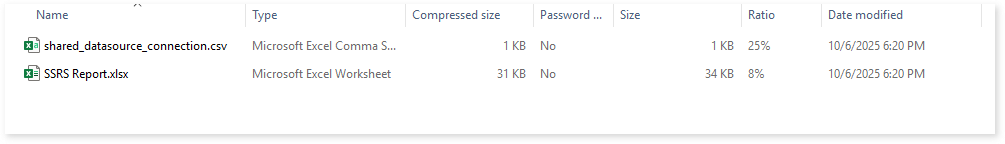
shared_datasource_connection.csv: This report provides details of shared data source connections including extension, connection string, and more.
SSRS Report.xlsx: This report provides insights about the source inventory. It helps you plan the next frontier of a modern data platform methodically. It includes information about reports and datasets.
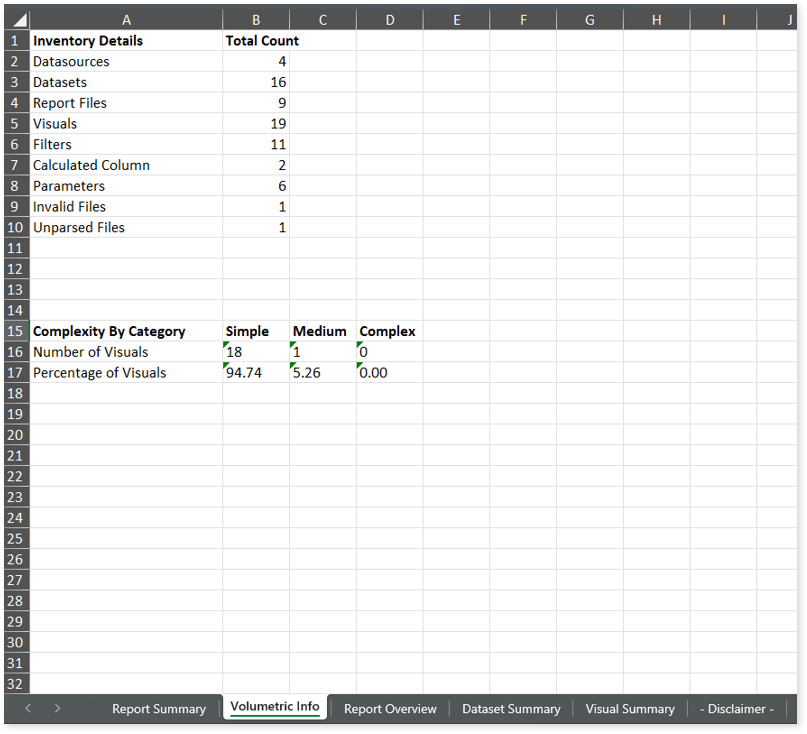
This report contains the following information:
- Report Summary: Provides information about all the generated artifacts.
- Volumetric Info: Presents a summary of the aggregated inventory after analyzing the source files. For instance, it provides volumetric info about the total number of data sources, data sets, report files, and likewise.
- Report Overview: Provides comprehensive information for reports including count of tablix, matrices, text boxes, charts, and more.
- Dataset Summary: Lists all the datasets along with information about the data sources, commands, query parameters, dataset filters, and more.
- Visual Summary: Lists all the visuals along with information about total number of columns, calculated columns, filters, and more
Source Inventory Analysis
It is an intermediate report which helps to debug failures or calculate the final report. It includes all the generated CSV reports. This folder contains a bi folder along with the keywordSearch.csv and Lineage_Raw.xlsx reports.
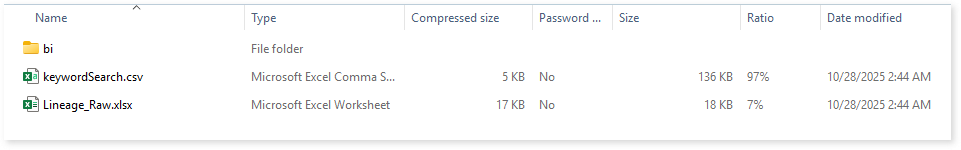
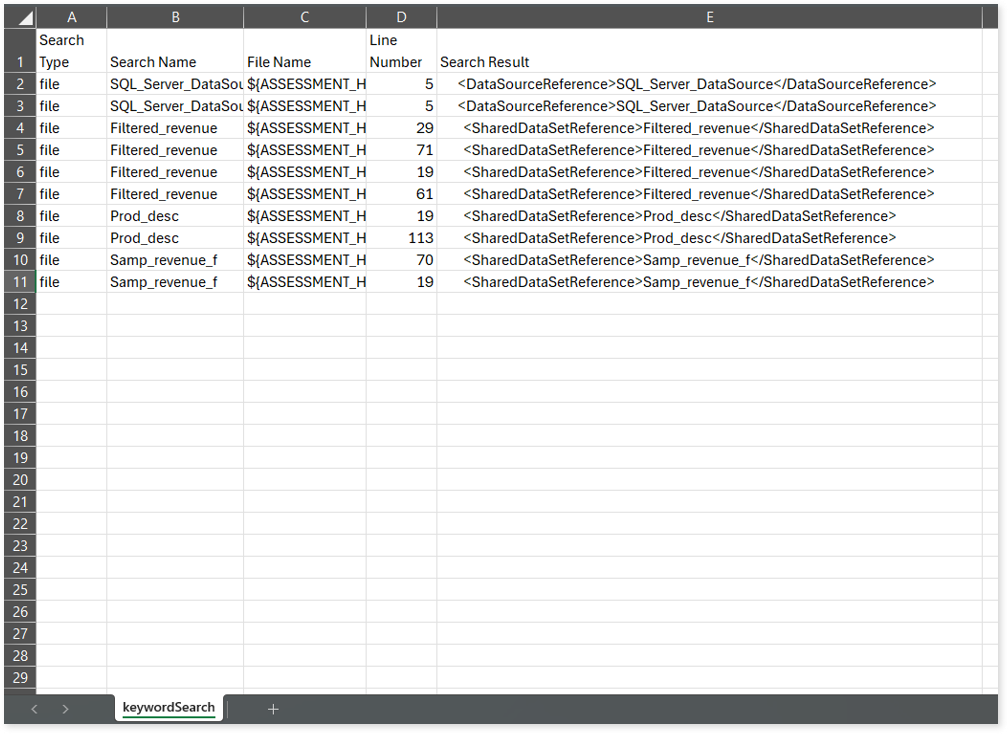
keywordSearch.csv: This report provides information about all the identified files using the file keyword search across uploaded source files. It includes details such as the search type, the file that contains the search keyword, the line number where it occurs, and other related information for each keyword.
This report helps to identify where specific file names appear across the uploaded source files. The system searches for each file name across all other uploaded source files, excluding the same file.
For example, if there are three files—File 1, File 2, and File 3—the system searches for occurrences of File 1 only in File 2 and File 3, excluding File 1 itself.
Lineage_Raw.xlsx: This report provides complete dependency details for all nodes. It provides an end-to-end data and process lineage that helps to identify the complete dependency structure and the data flow.
This report contains the following information:
- Volumetric Info: Provides volumetric information about the artifact types including tables, databases, and reports.
- Nodes: Lists all the source and target nodes along with their type. Each node represents a data object in the lineage making it easier to trace how data is consumed, transformed, and processed across the flow.
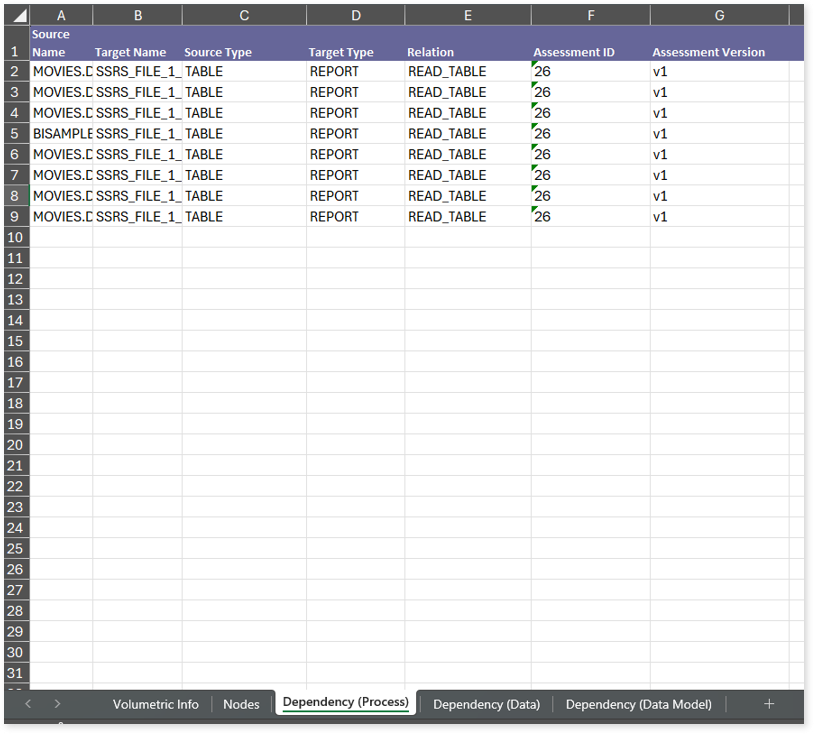
- Dependency (Process): Provides information about the process lineage. It offers detailed visibility into interdependencies between processes—such as entities and reports—helping you understand how they are connected within the flow.
- Dependency (Data): Provides information about the data lineage. It captures detailed table-level dependencies, offering end-to-end visibility into how data flows and transforms across the flow.
- Dependency (Data Model): Provides dependency details about the data models. It highlights the end-to-end relationships and dependencies between model elements (databases, entities and reports), helping users understand structure and trace linkages.
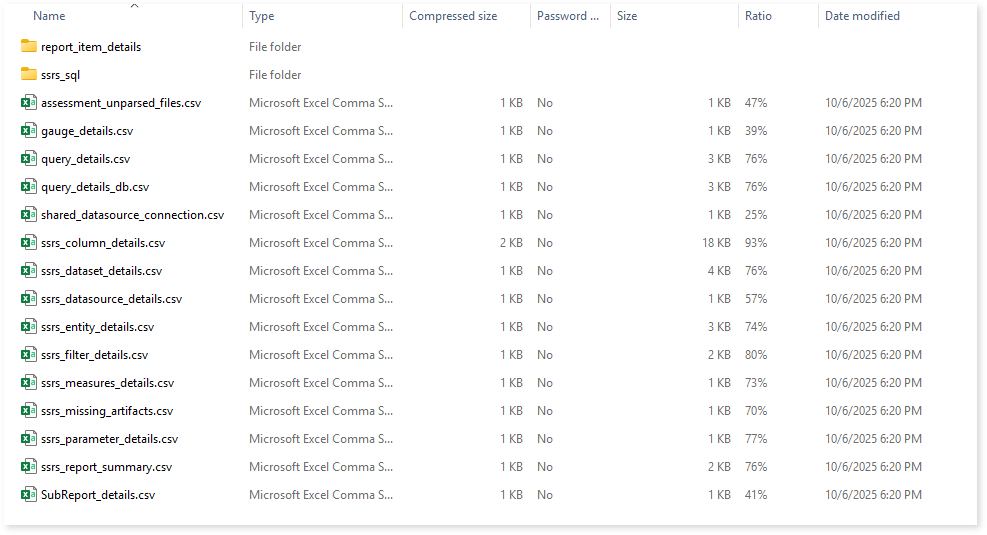
Browse through bi > ssrs folders to access all the generated CSV reports such as ssrs_dataset_details.csv, ssrs_missing_artifacts.csv, ssrs_report_summary.csv, and more.
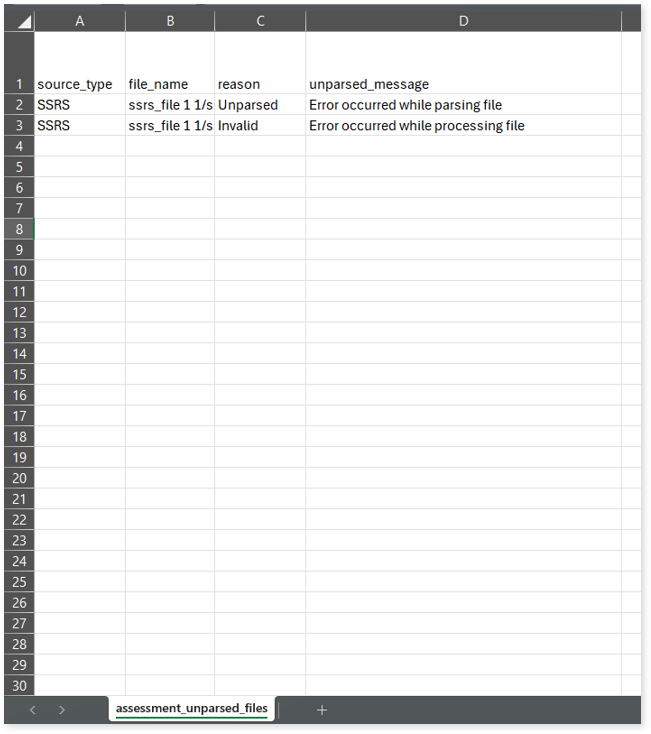
assessment_unparsed_files.csv: This report lists all the unparsed SSRS files along with the reason for parsing failure.
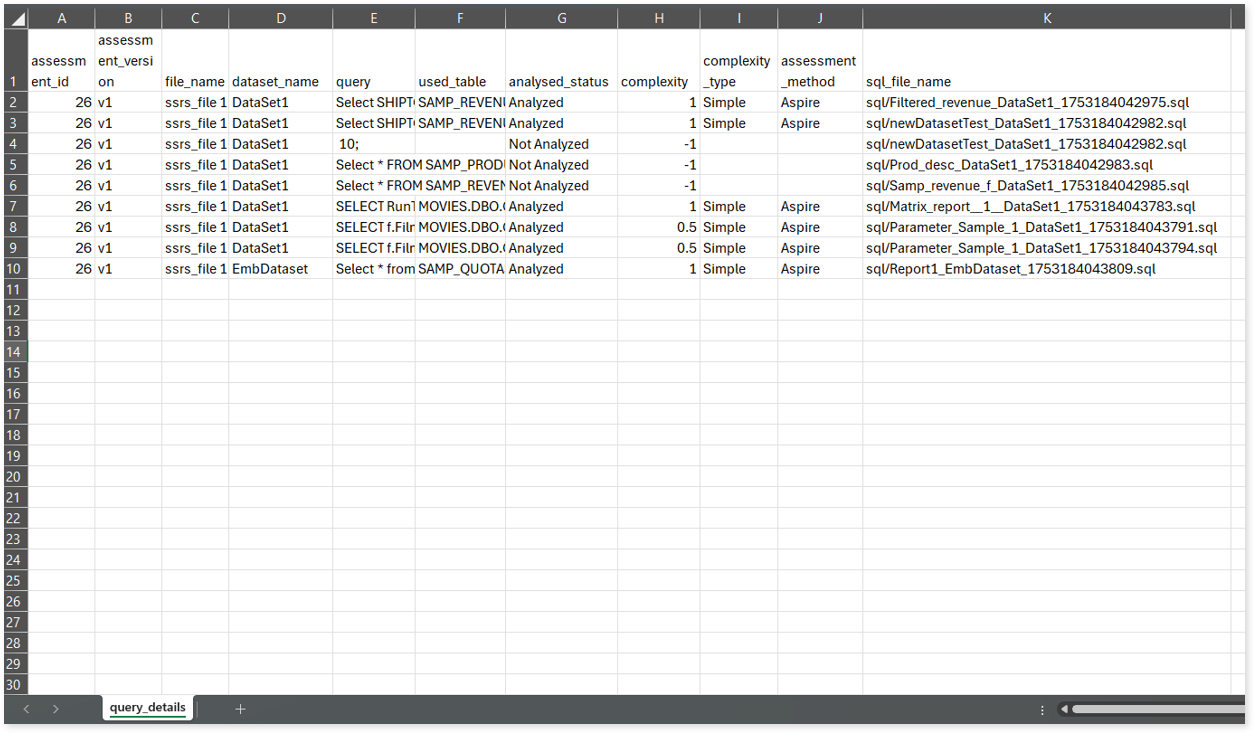
query_details.csv: This report provides information about queries including the used tables, analyzed status, complexity, assessment mode, and more. If the analyzed status is Analyzed, it indicates that the query is analyzed successfully. Conversely, a Not Analyzed status indicates that the query is not analyzed.
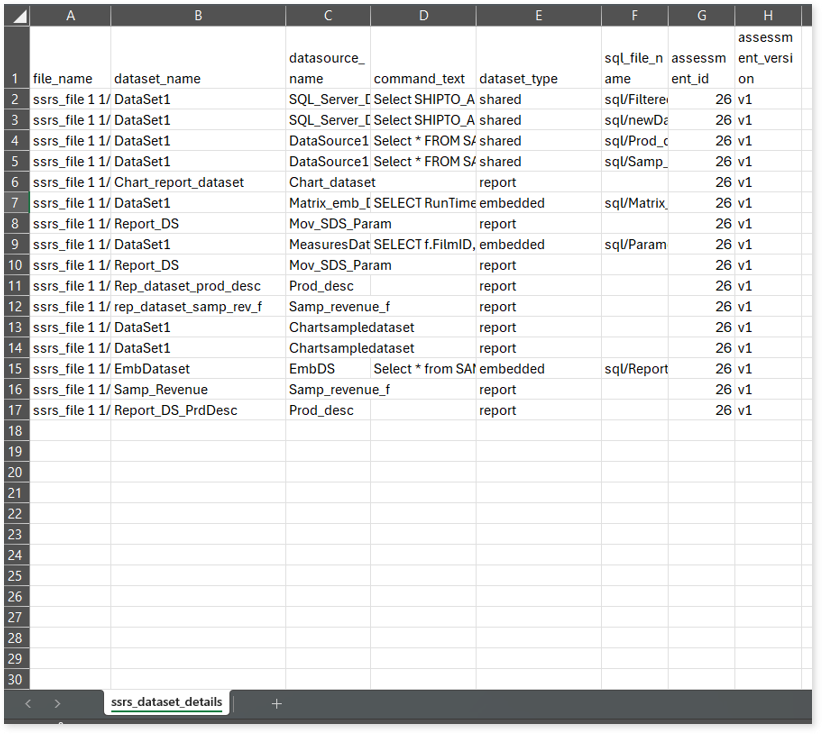
ssrs_dataset_details.csv: This report provides information about datasets including data sources, dataset types, and more.
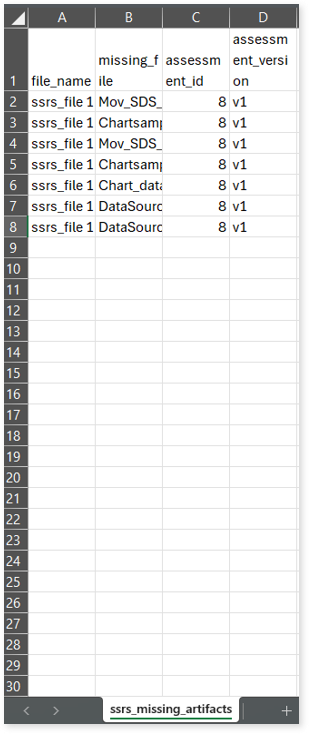
ssrs_missing_artifacts.csv: This report provides information about missing artifacts.
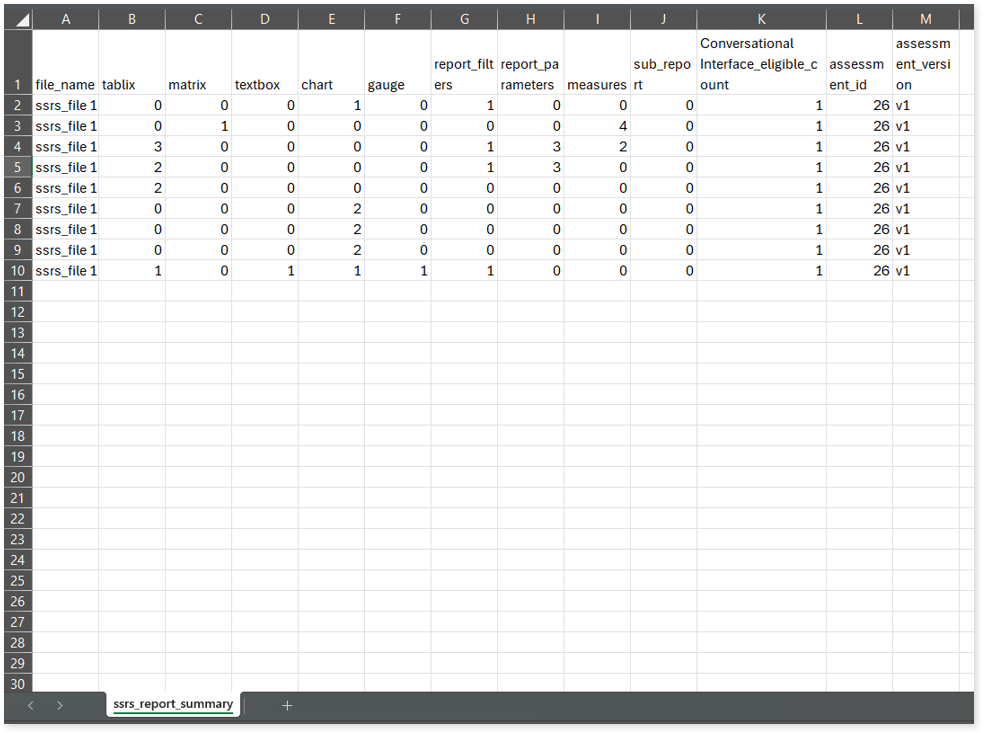
ssrs_report_summary.csv: This report provides comprehensive information on SSRS reports, including the count of matrices, text boxes, charts, eligible candidates recommended for Conversational Interface, and more.
Lineage Analysis
This section provides lineage-related reports, including entity_link.csv, entity_report.csv, entity_summary.csv, link.csv, script_report.csv reports.
entity_links.csv: This report provides information about how views are connected to entities or tables and how these links extend across multiple levels. Level 1 shows the immediate table to which a view is linked. If that table is further connected to another entity, the next connection appears in Level 2, and so on.
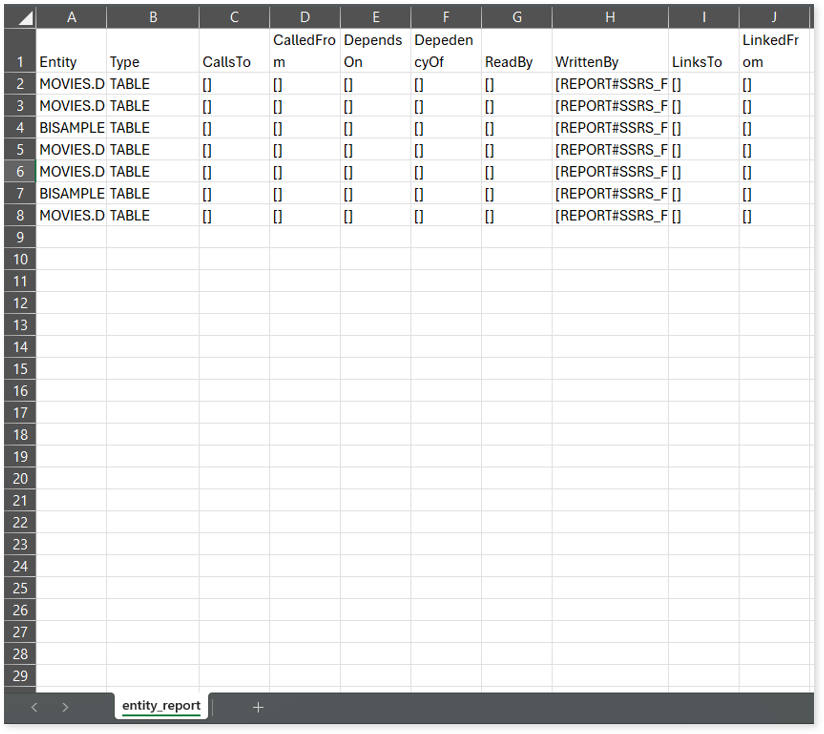
entity_report.csv: This report provides detailed lineage information for each entity within the uploaded source files. It provides a comprehensive list of all entities along with their respective types, identifies the processes, entities, or scripts that read from or write to each entity, and includes other dependency details.
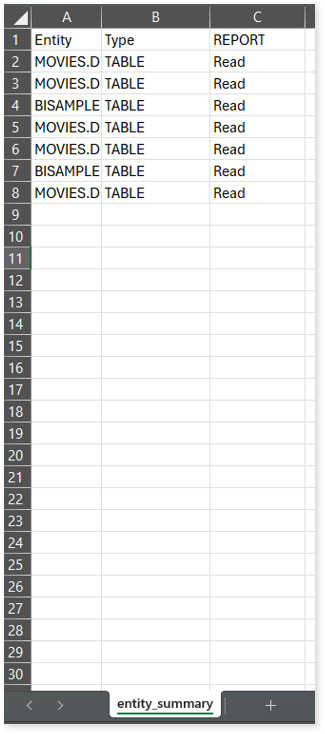
entity_summary.csv: This report provides a list of entities from uploaded source files, indicating where they appear (e.g., reports) and the operations performed on them—Read, Write, or ReadWrite.
link.csv: This report provides information about entities linked to each view.
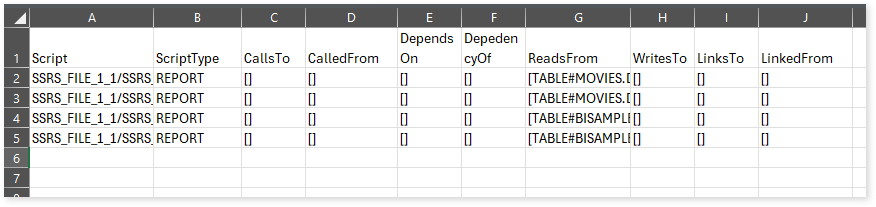
script_report.csv: This report provides detailed lineage information for each script. It lists all scripts along with their type, specifies the processes, entities, or scripts from which each script reads data and those to which it writes, as well as other dependency details.